The Cycle Started.
Your Sizing Just Got Harder.
Week of September 22 · PLNT · NVDA · GNRC
Three entries on the same Tuesday — with downside sigma running from 3.99% to 14.45%. Every number is below, including the ones that decide how much you put on.
“Too high … for too long”
The FOMC voted 12–0 to raise the federal funds rate a quarter point to 3.75%–4.00% — the first increase since 2023. Chair Warsh said inflation has been “too high … for too long.”
The dot plot is the part that matters. Sixteen of eighteen participants expect at least one more hike this year, and four pencilled in two. There are no cuts projected for 2027 at all, with the median holding near 4.1%. Stocks fell on the guidance rather than the hike, and HSBC now expects another increase in December.
For nine months the question was whether the Fed would hike. That question is now closed, and a different one replaces it: how many more, and how fast. Sixteen of eighteen officials say at least one more this year. No cuts at all in 2027. That is a different regime for anything priced on future cash flows.
Which is why the spread on this week's board matters more than usual. Downside sigma runs from 3.99% to 14.45% — a 3.6x range across three names entering on the same day. One is nearly uncorrelated to the index. One is the most rate-sensitive stock in the market. Same week, three completely different amounts of risk.
The New Super Seasonal is live in your account.
Every pick on the board below now carries twelve statistics instead of four — dependability, upside and downside, including the worst year and the worst closing drawdown on record. That third band is the one that decides position size, and it is the reason this week’s three names are sized so differently.
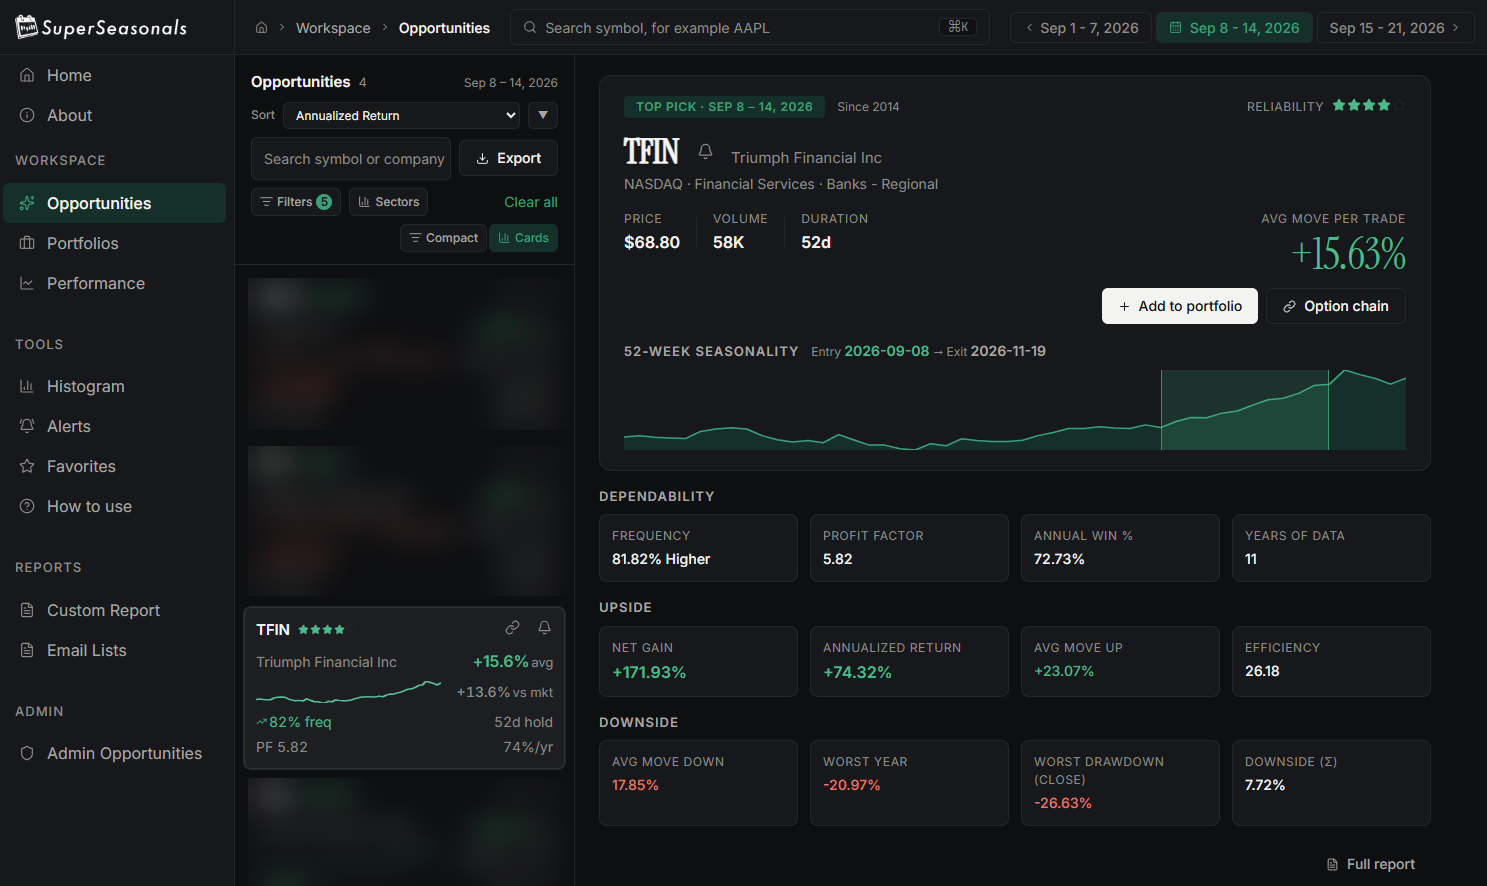
And you no longer have to come looking. Set your Opportunity Filters once — reliability, profit factor, downside sigma, holding period, win rate — and Super Seasonal emails you the moment a setup matches. Your criteria, your thresholds. If nothing qualifies, you hear nothing.
Set Your Opportunity FiltersThe best risk-adjusted setup on the board
PLNT is the only five-star reliability rating on this week's board, and the row explains why. A 90.91% frequency is the highest here. A 34.97 efficiency score is the highest we have ever printed. And the downside band is remarkably tight for a consumer name: a 3.99% sigma with a worst year and worst drawdown that are the same number, -13.22%.
That last detail is worth a second. When worst year and worst closing drawdown match exactly, it tells you the bad years were single clean drawdowns rather than grinding bleed. Across eleven years, this window's failures have been shallow and self-contained.
The business has been beaten up far harder than the numbers deserve. Planet Fitness runs a low-cost, heavily franchised gym model — 2,930 clubs, more than 21 million members, and commitments for roughly 800 more. Q2 revenue rose 7.1% to $365.2 million against a $356.7 million consensus, EPS of $0.88 beat by a nickel, adjusted EBITDA reached $152.8 million, and the company retired about $200 million of stock.
The stock is down roughly 50% over the past year — from a $114 high to about $50 — while earnings per share grew 23% annually over three years. Eighteen analysts average a $67.54 target, about 31% above the price, with Jefferies at $106. Two directors have been buying: one purchased roughly 10,000 shares at $49.28, a trade equal to 31% of his entire holding.
One: a securities class action was filed over claims about accelerated growth and new member numbers. Two: the company trimmed its full-year adjusted earnings outlook on higher interest expense, and carries roughly $2 billion of net debt into a Fed that just started hiking. Three: earnings land November 5 — one day before this window closes.
Here is the quiet reason PLNT fits this particular week: its beta is roughly -0.60 with a correlation to the S&P near 0.02. It barely trades with the index at all. In a week when the Fed has just started a hiking cycle and everything else is repricing to one policy path, that independence is worth something real.
PLNT is the best risk-adjusted setup on this board: the only five-star rating, the highest frequency, the highest efficiency score we have published, and a 3.99% downside sigma. The risks are a live class action, $2bn of net debt into a hiking cycle, and an earnings print one day before the exit.
Twenty-seven years of data, and the roughest downside we publish
Read this row top to bottom before you react to any single number. A +587.33% net gain across 27 years is the largest cumulative figure we have ever published. So is the -55.56% worst closing drawdown. So is the 14.45% downside sigma — nearly four times PLNT's.
This is the single clearest argument for why we now print the downside band at all. Under the old four-stat format you would have seen an 85.19% frequency and a +83.05% annualized return and stopped reading. You would not have seen that the average losing move in this window is 33.98%, or that one year in this sample lost almost exactly half.
Second-quarter data centre revenue hit a record $89.02 billion, up 116.6% year over year, on the Blackwell Ultra ramp. Full fiscal-year revenue reached $215.9 billion, up 65%. Of 61 analysts, 58 rate it Buy or Strong Buy, with an average target near $305 — roughly 44% above the current price.
Here is the oddity: despite all of that, NVDA is up only about 13% year to date. The market has spent 2026 worrying about AI capex digestion rather than paying up for the growth. That gap between fundamentals and price action is what a seasonal window is designed to exploit.
This window runs September 22 to December 23 — 65 days. It spans NVDA's next earnings report, the December FOMC meeting at which most officials now expect another hike, and the year-end rebalancing window. Add a looming memory-price correction flagged as a margin risk and a 30x normalised multiple on a $5.17 trillion company.
Long-duration growth is precisely what a hiking cycle punishes, and the Fed just started one with more signalled. NVDA is the most rate-sensitive name here. The 14.45% sigma is the number that should set your size, not the 587%.
NVDA carries the deepest history on the board (27 years), the largest cumulative gain we have ever published, and by a wide margin the roughest downside record. Conviction is not the question. Size is.
The one the news just rewrote
The lowest reliability rating on this board at three stars, and the weakest profit factor here at 2.82. And then, 48 hours before this window opens, the company signed an agreement that repriced the stock as much as 40% overnight — and quietly made sixteen years of seasonal history describe a different business than the one you would be buying.
On September 16 Generac closed at $175.11. On September 17 it opened around $229.50 and settled into the low $210s — up as much as 40% in extended trading after announcing a long-term supply agreement to provide backup generators for Amazon's data centres. Initial deliveries total $2.4 billion across 2027 and 2028, with total payments potentially reaching $8 billion.
One outlet put it precisely: the agreement repriced Generac from a hurricane-season consumer name into AI infrastructure. That sentence is the whole problem and the whole opportunity.
The fundamentals were already turning. Q2 net sales rose 11% with the commercial and industrial segment up 29% on data-centre demand, adjusted EBITDA margin reached 24.8%, and management raised C&I guidance against a $1.6 billion backlog. Cantor Fitzgerald reiterated Overweight at $333.
The seasonal history describes a different company. Sixteen years of data were built on a business selling home standby generators into hurricane season. The stock that starts this window on September 22 is being valued as an AI data-centre supplier after a 40% two-day repricing. You would be entering after the move, on a pattern built from a company that no longer trades on the same thesis. Barclays sits at Equal Weight with a lowered $278 target.
Generac is two-sided on rates: higher borrowing costs pressure residential generator financing, while the data-centre contracts are long-dated industrial commitments largely insulated from the consumer.
GNRC is the most honest test of how you use this newsletter. The scan gives it three stars and a 2.82 profit factor. The news gives it an $8 billion Amazon agreement and a $333 Overweight target. If you take it, take it because of the deal — not because of the pattern.
The three, side by side
| Ticker | Rating | Freq. | Profit Factor | Ann. Return | Worst Drawdown | Downside Σ | Years |
|---|---|---|---|---|---|---|---|
| PLNTPlanet Fitness | 5 / 5 | 90.91% | 10.84 | +87.61% | -13.22% | 3.99% | 11 |
| NVDANVIDIA | 4 / 5 | 85.19% | 5.32 | +83.05% | -55.56% | 14.45% | 27 |
| GNRCGenerac | 3 / 5 | 81.25% | 2.82 | +75.13% | -37.15% | 10.80% | 16 |
The market got louder on Wednesday. Your process shouldn't.
A hiking cycle does not make good setups disappear. It makes knowing your downside before you enter the difference between a position you can hold and one you panic out of.
The goal was never to trade more. It was to trade fewer, better-prepared ideas — and to spend the rest of the week not worrying about them.
Open This Week's Full BoardThe Big Picture
Three entries on the same Tuesday, and almost nothing else in common.
Look at the downside column one more time. PLNT: 3.99%. GNRC: 10.80%. NVDA: 14.45%. These three enter on the same morning and carry wildly different amounts of risk — and under the old four-statistic format, you could not have seen that. NVDA's 85% frequency and PLNT's 90.91% look like cousins until you read one band lower and find that one of them has lost half its value in a bad year and the other has never lost more than 13.2%.
That is the entire reason we rebuilt this. Not to give you more numbers — to give you the ones that decide position size. The Fed just started a hiking cycle with more to come. This is a poor week to be guessing at your downside.
Super Seasonal Trade Desk
Pulling Back the Curtain for 90 Days.
See exactly what trades Ryan is taking, three times a week, for the next ninety days.
This watchlist tells you when the calendar has historically favoured a setup. LaunchPad shows you something different: someone actually trading — three times a week, for ninety days, with nothing edited out.
Trading involves risk, including the possible loss of principal. Trades shown are for education and illustration and are not personalized financial advice or a recommendation to buy or sell any security. Past results do not guarantee future performance.