One Day
of History.Week of November 23 · LNG · ASND · EXPE
The largest IPO in history began trading on Thursday. It raised $81 billion and carries one day of price history — not one statistic on our cards can be calculated for it.
$81 billion raised. One day of price history.
Anthropic priced 980 million shares at $83 on Wednesday night — above its own $70 to $78 range — and began trading on the Nasdaq Thursday under the ticker ANT. It raised roughly $81 billion at an implied valuation near $1.5 trillion, the largest listing in market history. By midday Friday it traded around $88.91, down 8.5% on the day on nearly 400 million shares, still about 7% above its offering price.
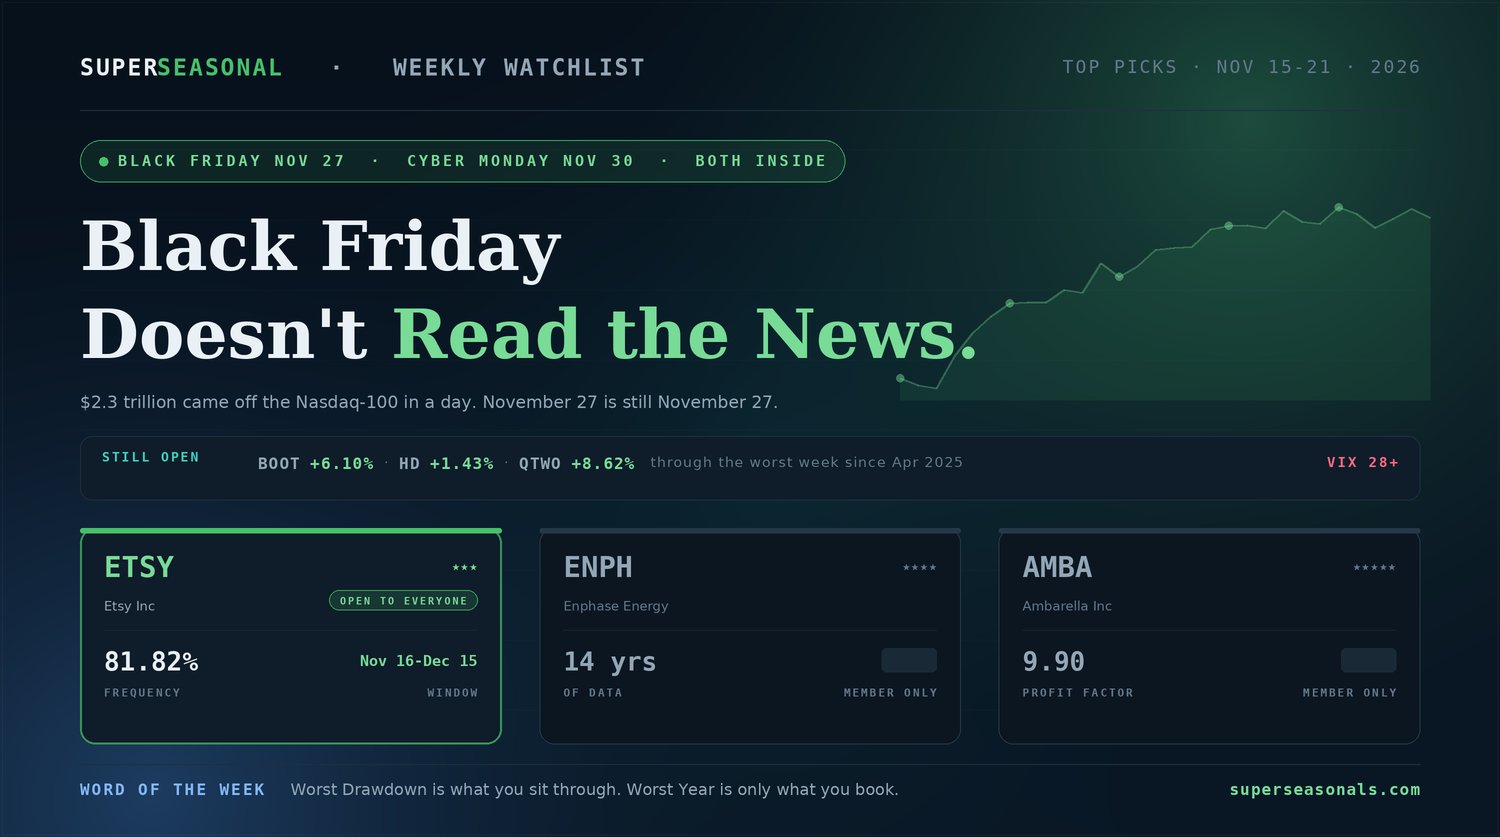
It did that in the middle of an AI selloff. Two weeks ago the Nasdaq-100 lost 6.36% in a single session and roughly $2.3 trillion of value. It priced above range anyway.
And here is the only observation about it that belongs in this newsletter. There is no frequency figure, because there is nothing to count. No worst year, because there has not been a year. No profit factor, no win rate, no drawdown record. Every number we print is, for that ticker, structurally impossible to calculate.
That is not a criticism of the company — it is a description of what a listing is. One of these is a story. The other is a record. You should be clear which one you are buying.
These three windows opened Monday, November 16. If you are reading this over the weekend you are four days in, not late — and all three are effectively still at their entry prices.
The unlocked window entered at $296.76 and traded near $295.43 at midday Friday, about 0.4% below entry on an 81-day hold. The second entered at $253.71 and sits near $252.20, roughly 0.6% below. The third entered at $239.50 and sits near $235.74, about 1.6% below.
That will not always be the case, and we will say so when it is not.
Prices are approximate as of midday November 20, 2026 and are not a representation of subscriber results. Verify live before trading.
Thirty Novembers, and the roughest ride on this board
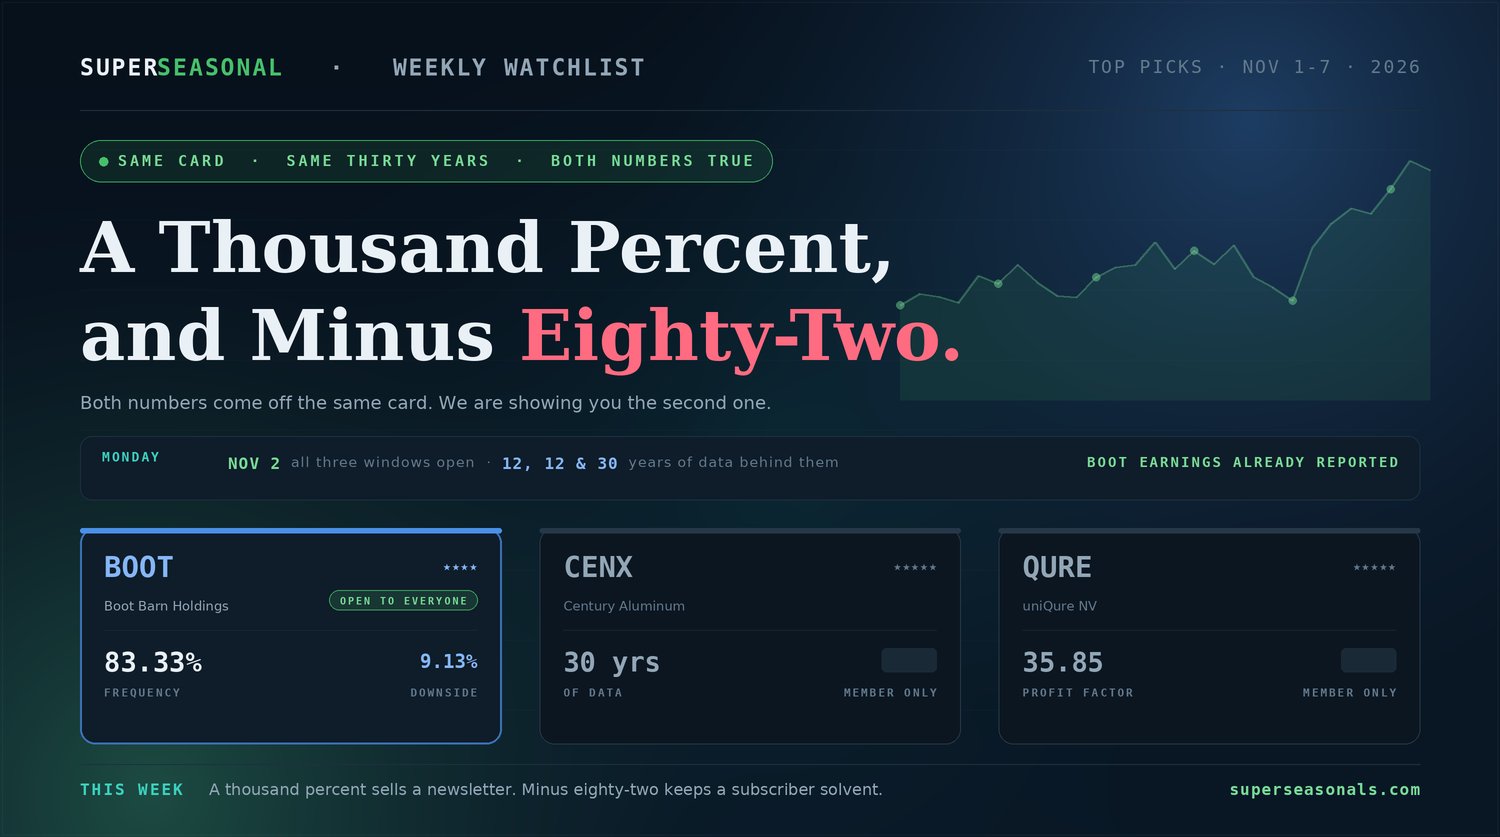
Cheniere Energy liquefies natural gas and ships it. It has been listed since 1994, which means the scanner has watched this same stretch of November through March thirty times — and the cumulative figure across those thirty years, +970.32%, is among the largest we have ever published.
The trend underneath is real, and we checked it rather than assuming it. Cheniere traded at $205.50 a year ago and sits near $295 now — up roughly 44% over twelve months. It set a record high of $330.73 on October 26 and is about 10% below it. On Friday, with Applied Materials down more than 8% and chip names being sold hard, Cheniere was green. It was one of very few names on our entire scan that was.
The window entered at $296.76 on November 16 and traded near $295.43 at midday Friday — roughly 0.4% below entry, four days into an 81-day hold. Nothing has been missed. The hold runs through the winter and exits March 16, which places the entire heating season inside it.
A -48.93% worst drawdown and an 11.29% downside sigma. A typical losing move of 24.24%. In its worst year this window lost 42.60%. That is not a footnote — it is roughly five times the volatility of the quietest card on this board, and on an 81-day hold you would be living inside it all winter. The 60.00% annual win rate is also the joint-lowest here. This window pays well and it does not pay gently.
LNG export economics turn on global gas spreads, shipping and weather rather than on the Fed directly, which is part of why this name was green on a day the rate-sensitive AI complex was being sold. The 81-day hold does span the December 9 decision and the one after it.
Thirty years of record, a 9.00 profit factor, the biggest average move on the board, and a live uptrend we verified rather than inferred. Against that: the widest downside band we have printed in weeks, a 60% annual win rate, and an 81-day hold that will test you. Size it against the 11.29% sigma, not against the 970%.
The most dependable card on the board
The most dependable card on this board. A 90.91% frequency and an 80.00% annual win rate — both the highest figures here by a clear margin, on eleven years of history and a hold of about three weeks.
It entered at $253.71 on November 16 and traded near $252.20 at midday Friday, roughly 0.6% below entry. What you cannot see is the downside band, and it is a fraction of the width of the card above — which is the entire point of the Word of the Week below.
Both dates, the upside and downside bands, the catalyst, the risk flags and the bottom line continue inside Super Seasonal.
The quietest card we have published in months
The quietest card we have published in months. Twenty-one years of history on a travel name, an 80.95% frequency, and the tightest downside sigma on this board by some distance — narrow enough that it reads more like a bond proxy than an equity.
It is also the shortest hold of the three, exiting well before the others. It entered at $239.50 and traded near $235.74 Friday, about 1.6% below entry. Set its sigma against the 11.29% on the unlocked card and you have the widest spread we have ever printed on one board.
Both dates, the upside and downside bands, the catalyst, the risk flags and the bottom line continue inside Super Seasonal.
The three, side by side
| Ticker | Rating | Years | Freq. | Profit Factor | Annual Win % | Worst Drawdown | Downside Σ |
|---|---|---|---|---|---|---|---|
| LNGCheniere Energy · unlocked | 5 / 5 | 30 | 83.33% | 9.00 | 60.00% | -48.93% | 11.29% |
| ASNDAscendis Pharma | 4 / 5 | 11 | 90.91% | 7.28 | 80.00% | -00.00% | 0.00% |
| EXPEExpedia Group | 4 / 5 | 21 | 80.95% | 6.96 | 60.00% | -00.00% | 0.00% |
Think of worst year as the deepest pothole on a road. Downside sigma is how bumpy the whole road was.
This week's board carries the widest spread we have ever printed on it.
That is a factor of more than five — on two cards that opened the same Monday morning, both four stars or better, both with frequencies above 80%. A star rating does not distinguish them. A frequency figure does not distinguish them. Sigma does, and it is the difference between a position you can forget about and one you will think about every day.
How to actually use it:
- It is the best single field for comparing two windows. Returns are not comparable across different holding periods. Volatility is.
- It should drive position size more directly than anything else on the card. A window with five times the sigma deserves a fraction of the allocation, not the same one.
- High sigma is not the same as bad. The widest card here also has the biggest average move and a 970% cumulative gain. You are being paid for that turbulence — the only question is whether you sized so you can sit through it.
Comparing two windows by their returns. An 81-day hold and a 16-day hold are not comparable on return and never were. Sigma is the field that lets you put them side by side honestly — and on this board it says one of them swings five times harder than the other.
A low-sigma window and a high-sigma window are not better and worse. They are different sized positions — and that decision gets made before you enter, or it gets made for you afterwards.
Every tool on this page needs a record. An IPO does not have one.
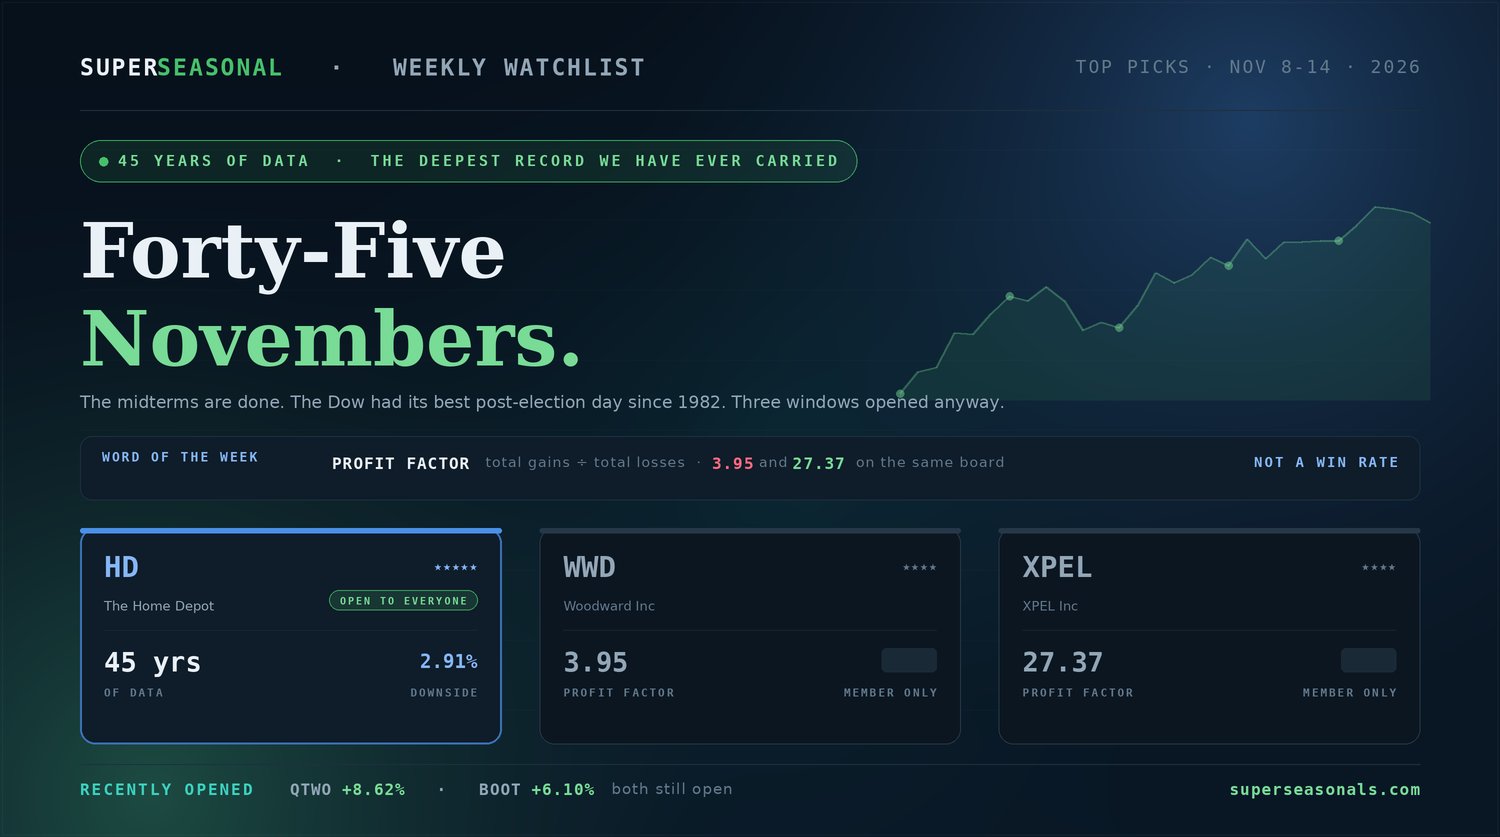
Thirty years. Twenty-one years. Eleven years. Take the record away and none of this works — which is exactly the position anyone looking at Thursday's listing is in.
Here is what our own card would look like for a company that listed yesterday:
Not low. Not weak. Impossible to calculate. There is no frequency because there is nothing to count. No worst year because there has not been a year. IPOs are the one corner of the market where seasonality has nothing whatsoever to say.
Which does not mean there is nothing to know. The lockup calendar, the float, the pricing mechanics and the behaviour of the first few weeks of trading run by rules of their own — and those are rules worth having before rather than after.
See the IPO PlaybookSeparate from your SuperSeasonals membership. Newly listed securities can be exceptionally volatile and may trade below their offering price. Nothing on this page is a recommendation to buy or sell any security, including any recently listed company mentioned. Trading involves risk, including the possible loss of principal. See the page for current details, pricing and terms.
The Big Picture
Thirty years, twenty-one years, eleven years — and across town, one day.
The largest IPO in history listed on Thursday, and the entire apparatus of this newsletter has nothing to say about it. No frequency. No worst year. No sigma. That is not a failure of the method — it is the method being honest about where it applies.
What it does have is this: a window with thirty years of evidence behind it, including the year it lost 42.60%, published before you decide anything. One of those two things is a story. The other is a record. Both can make money. Only one of them tells you what it costs when it does not.
Super Seasonal Trade Desk