Black Friday
Doesn't Read the News.Week of November 16 · ETSY · ENPH · AMBA
The market just had its worst session in nineteen months and $2.3 trillion came off the Nasdaq-100 in a day. Black Friday is still on November 27.
$2.3 trillion came off the Nasdaq-100 in a single day
On Thursday, November 5, the S&P 500 fell 4.36% and the Nasdaq-100 fell 6.36%. AMD dropped 17%, Micron 17.5%, Nvidia 9% — the worst day for chip stocks since March 2020. The VIX closed above 28, its highest since March. The Dow gave back every point of its post-election rally.
The cause was not earnings or inflation. It was a re-pricing of the AI buildout after the Democratic sweep raised the prospect of data-centre construction limits, with weak guidance from Qualcomm and Arm on top. The Nasdaq is in correction, roughly 13% below its October high. Friday clawed some back: October payrolls came in at 165,000 with unemployment at 4.1%, and odds of a December hike slipped from about 83% to 67%. The next decision is December 9.
None of which has anything to do with whether people buy Christmas presents. The AI trade is being repriced on a thesis about capital spending three years out. Black Friday is on November 27 whatever the Nasdaq does between now and then. Two of the three windows opening Monday sit squarely in the sectors that just got wrecked. The third sells handmade goods into the busiest shopping fortnight of the year.
We unlock one window per board and gate the rest. Those three just ran straight through the worst week the market has had since April 2025.
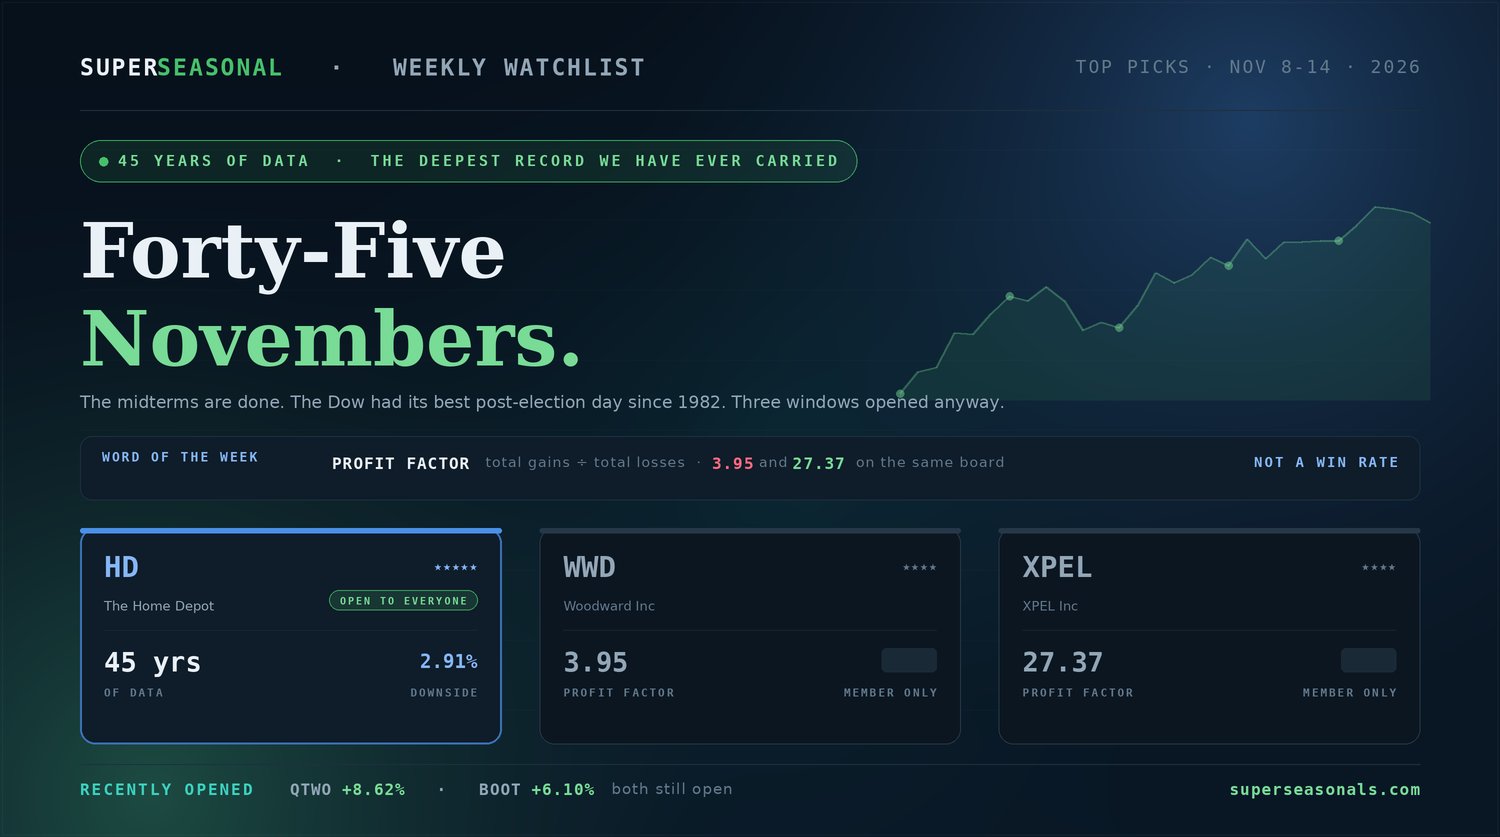
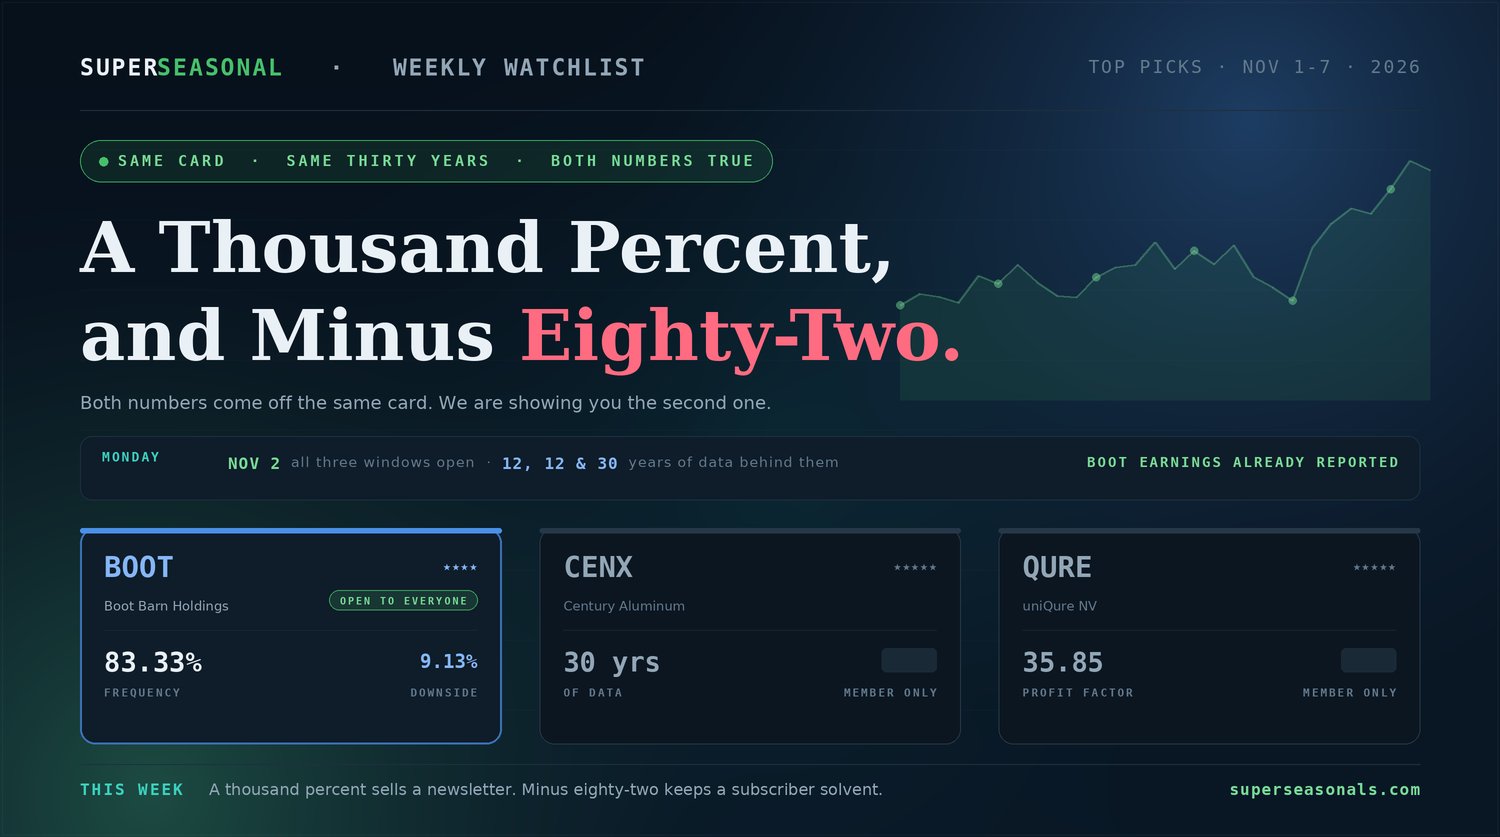
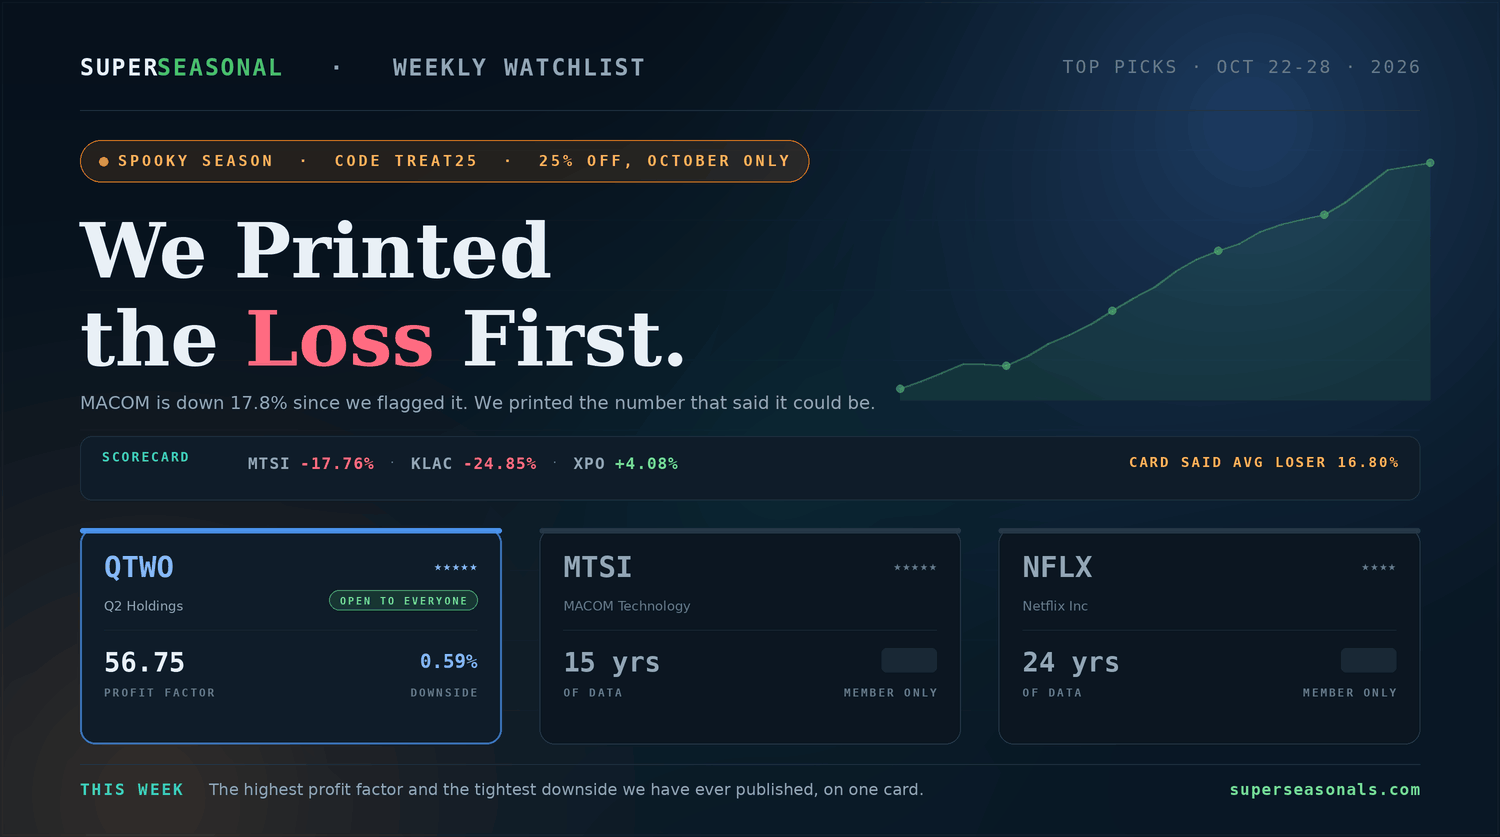
BOOT — published November 2 at $130.62, three days before the crash. Marked at $138.59 on November 5, up 6.10%, on the day the S&P fell 4.36%. HD — published November 9 at $343.35, closing Thursday at $348.26, up 1.43% with the Nasdaq still in correction. QTWO — published October 22 at $69.62 and marked at $75.62, up 8.62%, before its window closed November 12.
We are not claiming skill in dodging a crash. We are pointing at what those three have in common: a home improvement retailer, a western wear chain and a community banking software provider. Not one of them is in the AI trade. The scanner was not avoiding the selloff — it was following a calendar that has nothing to do with it.
Figures reference publicly reported closing prices on the dates stated. They are not a representation of subscriber results and exclude commissions, fees and slippage.
The one window on this board that has a reason
Most seasonal patterns are a statistical observation in search of an explanation. You find a stretch of weeks that has repeated and the why is buried somewhere in an order book or a tax year. This one does not require digging. Look at the dates.
The window opens November 16 and closes December 15. Black Friday is November 27. Cyber Monday is November 30. The hold brackets the highest-volume shopping fortnight on the retail calendar from start to finish, and exits before the late-December slowdown. An 81.82% frequency over eleven years is not a coincidence that needs a theory — it is the holiday shopping season showing up in a share price.
Etsy reported third quarter results on October 28, before this window opens. Earnings of $1.55 a share beat consensus by 15.67%. Marketplace GMS rose 8.8% to $2.6 billion and revenue 10.9% to $692 million. Active buyers returned to year-over-year growth for the first time in two years, reaching roughly 88 million with 540,000 added sequentially and gross buyer additions up 6.2%. Adjusted EBITDA hit $210 million at a 30.4% margin, growing faster than revenue for a second straight quarter, with 112% of it converted to free cash flow. Management guided fourth-quarter GMS to $3.46–$3.52 billion, up 5–7% — the holiday quarter, explicitly. The company repurchased about $395 million of stock in the quarter.
Three stars is the weakest rating here, and it reflects eleven years of data — the shallowest record on the page. The 60.00% annual win rate is also the lowest of the three. The worst year on record is -20.09%, and it is identical to the worst drawdown, which tells you something specific that the Word of the Week explains below. Shopify fell 17% on a GMV miss the same week Etsy reported, so sector read-across risk is live. And there is a CFO transition in progress.
Discretionary retail is exposed to the consumer and to credit, and the next Fed decision lands December 9 — six days before this window closes. The offset is that the holiday calendar is the least discretionary thing in discretionary spending, and the AI repricing that drove last week's selloff has no mechanical link to it.
A twenty-day window that opens with earnings reported and beaten, brackets Black Friday and Cyber Monday, closes before the year-end slowdown, and sits on a business that just guided its holiday quarter up 5–7% with buyer growth positive for the first time since 2024. The weaknesses are real: three stars, eleven years, a 60% annual win rate and live sector read-across risk. What a star rating cannot measure is whether a pattern has a reason — and this is the most obvious reason we have published all year.
Standing in the fire, with the best efficiency score here
Standing directly in the fire. Solar technology, fourteen years behind this window, an 85.71% frequency — and the highest efficiency score on this board, which measures how cleanly the window travelled rather than how far.
Its sector was among those repriced hardest in the past fortnight. The seasonal pattern has repeated for fourteen years regardless of what any given November looked like. Whether that makes this an opportunity or a falling knife is a question its downside band answers — and it is the widest of the three.
Both dates, the upside and downside bands, the catalyst, the risk flags and the bottom line continue inside Super Seasonal.
The only five-star card here — in the sector that fell hardest
Semiconductor equipment. Fourteen years, the same 85.71% frequency as the card above, five stars — the only five-star rating on this board — and a profit factor roughly double the window we unlocked at the top of this page.
Chip stocks had their worst session since March 2020 eight days ago. This card's downside band is materially tighter than the solar window above it, despite sitting in the sector that was sold hardest. Those two facts together are the entire reason to read the third band before deciding anything.
Both dates, the upside and downside bands, the catalyst, the risk flags and the bottom line continue inside Super Seasonal.
The three, side by side
| Ticker | Rating | Years | Freq. | Profit Factor | Annual Win % | Worst Drawdown | Downside Σ |
|---|---|---|---|---|---|---|---|
| ETSYEtsy · unlocked | 3 / 5 | 11 | 81.82% | 5.15 | 60.00% | -20.09% | 6.34% |
| ENPHEnphase Energy | 4 / 5 | 14 | 85.71% | 4.82 | 61.54% | -00.00% | 0.00% |
| AMBAAmbarella Inc | 5 / 5 | 14 | 85.71% | 9.90 | 61.54% | -00.00% | 0.00% |
Worst Year is what you booked. Worst Drawdown is what you had to sit through to book it.
This week's board shows both cases side by side, which is why it is this week's word.
When the two figures are identical, the worst year finished at its lowest point. It went down and stayed down until the exit date arrived — no reprieve. When the drawdown is deeper than the worst year, the position dug a hole and then climbed part of the way back before the window closed.
Why this matters more than almost anything else on the card:
- You do not experience the worst year. You experience the drawdown. A trade that ends down 17% after being down 19% felt like a 19% loss for most of the time you held it.
- The gap between the two numbers is a recovery you only collect if you are still in the position. Most people sell into the hole and never find out it climbed back.
- Size against the drawdown, not the final result. Size against the worst year and you will be forced out during the part that never shows up in the statistic.
Reading Worst Year and assuming it describes the experience. It describes the outcome. The experience is in the drawdown column, and the distance between the two is exactly the stretch where most traders abandon a position that was about to work.
That is a different question from whether the pattern works — and it is why there are twelve numbers on every card instead of four.
The drawdown is dead time. It does not have to be.
Go back to the Word of the Week for a second. The drawdown is the stretch where your position is underwater and your job is to do nothing — capital committed, thesis intact, waiting for a date on the calendar to arrive.
For most traders that period is completely unproductive. The money is tied up, the position is red, and the only thing being spent is patience. You are paying for the eventual recovery with weeks of dead capital.
That stretch is exactly where option structures earn their keep. Not as a replacement for the window — as something you run inside it. And a seasonal window is unusually well suited to it, because you already know the two things these structures need: the day you entered and the day you plan to be out.
Ryan runs it live in December. Dates, format and the early bird terms are on the page.
Claim Early Bird PricingHigh probability is not certainty. These structures can and do lose, and options carry risks the underlying shares do not, including total loss of premium and assignment. Separate from your SuperSeasonals membership. Options involve significant risk and are not suitable for every investor; read the Characteristics and Risks of Standardized Options before trading. See the page for current dates, pricing and terms.
The Big Picture
Two windows in the wreckage, and one in the shopping aisle.
We unlocked the lowest-rated card on the board this week, and we did it deliberately. Three stars reflects eleven years of data, which is a real weakness and we have printed it. But a star rating measures how much evidence stands behind a pattern. It cannot measure whether the pattern has a reason.
Most seasonal windows need a theory. This one needs a calendar. Black Friday is November 27 and Cyber Monday is November 30, and no amount of data-centre legislation moves either of those dates. Eight days ago $2.3 trillion came off the Nasdaq in a session. Eighty-eight million people are still going to buy presents.
Super Seasonal Trade Desk