We Printed
the Loss First.Week of October 22 · QTWO · MTSI · NFLX
Three weeks ago we told you MACOM was up 14.7% since we flagged it. It is now down 17.8% from where we published it — and the number that said it could be was printed on the card four weeks in advance.
Three weeks ago we told you MACOM was up 14.7% since we flagged it. That was true — we published MTSI on September 29 at $288.29, and nine days later it closed at $330.75.
MACOM closed Thursday at $237.09. That is 17.8% below where we published it.
We are opening with that rather than burying it, because of what sat on the card. MTSI's September write-up printed an average losing move of 16.80% and a worst closing drawdown of 32.36%. It is down 17.76%. That is almost exactly the number we printed. The band did the job it exists to do — it said, before you entered, roughly what a bad outcome in this name looks like. Anyone who sized against 16.80% is annoyed. Anyone who sized against the 91.67% frequency and ignored the rest is in trouble.
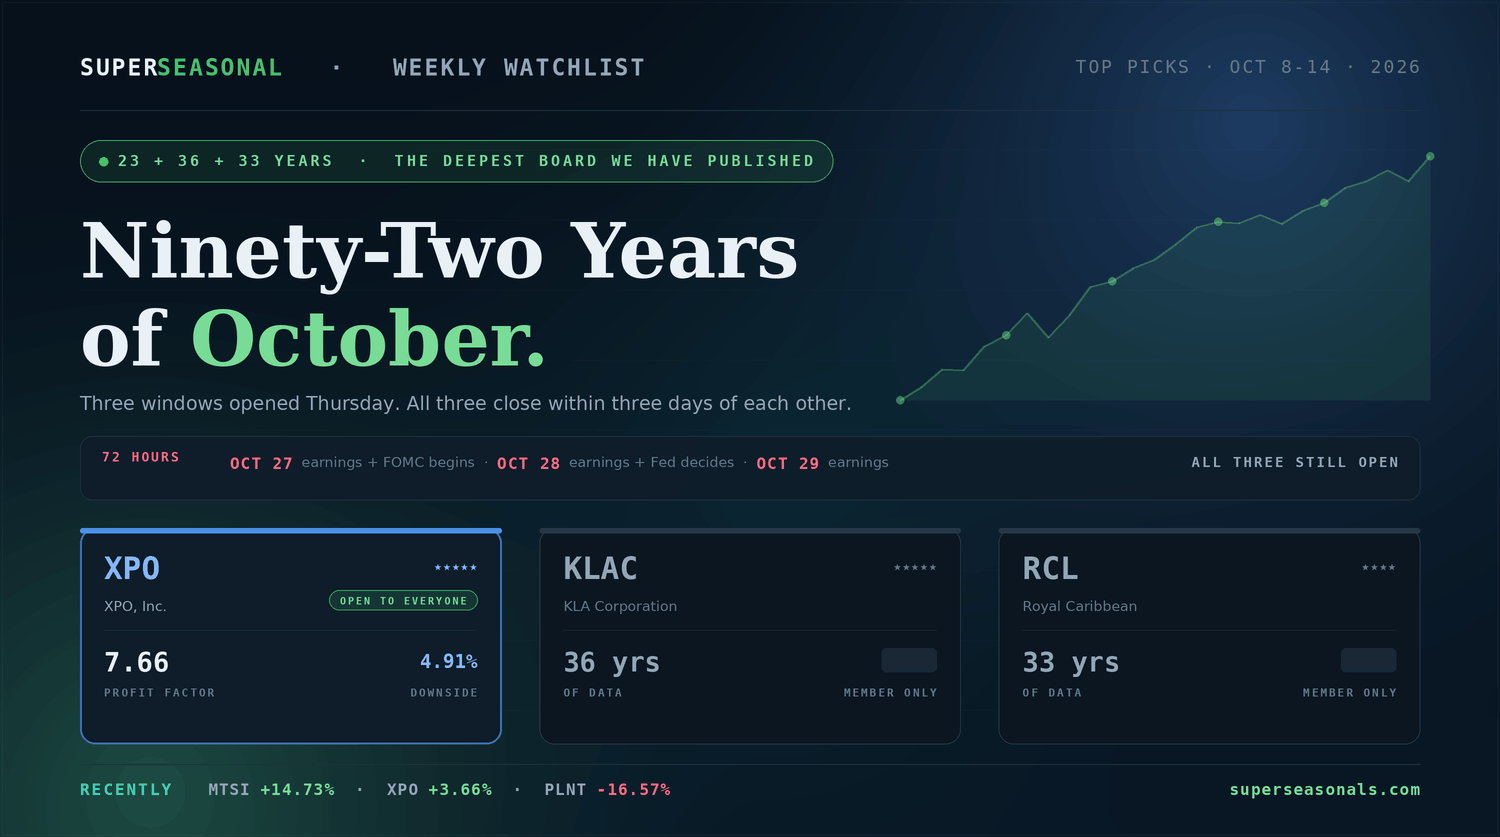
And it is not the only red. KLAC, published October 8 at $196.72, closed Thursday at $147.83 — down 24.85% in a sector-wide semiconductor sell-off; its card gave a worst drawdown of 39.92%. XPO, published September 29 at $175.53, closed at $182.70 — up 4.08%, and still green on the second window we opened on it October 8.
One up, two down, through the worst three weeks semiconductors have had this year. We would rather you read that from us than work it out yourself. A service that only shows you the green weeks is not a service, it is a highlight reel.
Figures reference publicly reported closing prices on the dates stated. They are not a representation of subscriber results and exclude commissions, fees and slippage.
The card that broke our scanner's records
Read the bottom row first, because it is the reason this card exists. A 0.59% downside sigma, a worst year of -2.03% and a typical losing move of 2.00%. Across twelve years of this window, the bad years were barely bad at all. Those are the tightest downside figures we have ever printed on anything.
Then the top row. A 56.75 profit factor is, by a distance, the highest number this scanner has ever returned on any pick we have published — it says that across the sample, gross gains in this window outweighed gross losses by more than fifty to one. Paired with a 91.67% frequency and a 15-day hold, it produces the +148.52% annualised figure in the upside band.
The business underneath is deliberately unglamorous. Q2 Holdings builds the digital banking platform that community banks and credit unions run on — digital banking, lending, relationship pricing, fraud and risk, increasingly with AI layered through it via its Q2 Assistant and Innovation Studio products. It is infrastructure software sold on subscription, and it sits in the flow of transactions rather than chasing them.
Second-quarter revenue reached $219.8 million, up 13%, with GAAP gross margin expanding to 59.2% from 53.6% a year earlier and net income of $29.9 million. Management raised full-year guidance to $881–886 million and authorised an additional $350 million buyback. Analysts forecast earnings growth near 26% a year, with a one-year target around $75.64 against a $69.62 price.
One: Q2 reports earnings on October 28 — inside this 15-day window. Two: twelve years is the shallowest record on this board; the window below it carries twenty-four. Three: the stock trades near 44 times trailing earnings, at least one technical read on it is outright bearish, and customer consolidation among community banks is a genuine structural risk to a subscription model built on them.
Digital banking software is indirectly rate-exposed: higher rates squeeze the small and mid-sized institutions that buy it. The 15-day hold is the shortest on this board and closes November 12, well clear of the December Fed meeting.
QTWO is the most extreme risk-adjusted card we have ever published: the highest profit factor, the tightest downside sigma, and a worst year of -2.03% across twelve years. The caveats are a shallow record, a rich multiple, and an earnings print landing inside a fifteen-day window.
The one from the scorecard — back, 27% cheaper
Yes — the one from the top of this page. The scanner has selected MACOM again, on a new 52-day window, at a price roughly 27% below where it traded two weeks ago after the semiconductor sell-off took it from $330.75 down to $237.09.
Fifteen years of data, five stars, and a dependability row you can read above. What you cannot see is the part that matters most right now: its downside band is materially tighter than the one we published in September, on every single measure. Whether a name that just fell 18% is a bargain or a falling knife is precisely what those four numbers are for.
Both dates, the upside and downside bands, the catalyst, the risk flags and the bottom line continue inside Super Seasonal.
The deepest record on the board — and the roughest
Twenty-four years of history — the deepest record on this board, twice the depth of the card above it — with an 87.5% frequency and a 78.26% annual win rate.
It is also the exact opposite of Q2 Holdings one card up. It carries the largest cumulative gain and the roughest worst drawdown we have ever put on any card, and the gap between its downside sigma and Q2's is roughly fifteen to one. Two strong windows opening the same morning, one swinging fifteen times harder than the other. That is the whole reason we print all twelve numbers.
Both dates, the upside and downside bands, the catalyst, the risk flags and the bottom line continue inside Super Seasonal.
The three, side by side
| Ticker | Rating | Years | Freq. | Profit Factor | Hold | Worst Drawdown | Downside Σ |
|---|---|---|---|---|---|---|---|
| QTWOQ2 Holdings · unlocked | 5 / 5 | 12 | 91.67% | 56.75 | 15d | -13.21% | 0.59% |
| MTSIMACOM Technology | 5 / 5 | 15 | 80.00% | 15.07 | 00d | -00.00% | 0.00% |
| NFLXNetflix Inc | 4 / 5 | 24 | 87.50% | 9.19 | 00d | -00.00% | 0.00% |
Trick, treat, or 25% off.
Through the end of October, code TREAT25 takes 25% off any SuperSeasonals plan — the full weekly board, all twelve statistics on every pick, the backtest engine running to 1993, saved-filter email alerts, portfolios and exports.
Enter it at checkout. October only.
Discount applies at checkout through the end of October. Seasonal statistics describe past behaviour and do not guarantee future results.
Same stock. Same calls. A completely different risk profile.
The illustration above bought a call. There is an entire other side of that chain — selling them — and it has become the most popular income strategy in retail trading while arguably being one of the worst.
The conventional covered call asks you to own a hundred shares outright so you can collect a premium against them. You tie up the full capital, you absorb every point of the drawdown, and in a flat year the income may not beat simply holding the stock.
at risk
drops
risk
over time
Same stock, same calls — built differently. It is the same argument this newsletter makes every week about the downside band: the structure you choose decides what being wrong costs you. Forty years of trading options went into it, and it ships as strategy, scans and tool in one.
Ends October 26 at midnight CT.
Separate from your SuperSeasonals membership. Figures quoted are the publisher's description of the strategy's structural risk profile, are not a projection of your results, and are not typical or guaranteed. Options involve significant risk and are not suitable for every investor; read the Characteristics and Risks of Standardized Options before trading. See the page for current pricing, inclusions and terms.
The Big Picture
The tightest card we have ever published, three inches from the roughest.
Here is this week in one line. Two of these windows carry four stars or better and open on the same Thursday morning, and one of them swings roughly fifteen times harder than the other. No star rating tells you that. No frequency figure tells you that. It only appears in the band underneath, and it is the only number that answers the question that actually decides your outcome: how much should I put on?
MACOM is this month's proof. We printed its average losing move at 16.80% four weeks before it fell 17.76%. The number was right. The question is whether you were reading it.
Super Seasonal Trade Desk