Forty-Five
Novembers.Week of November 9 · HD · WWD · XPEL
Democrats swept both chambers Tuesday and the Dow put on its biggest post-midterm day since 1982. Three windows opened anyway — one of them carrying forty-five years of history.
Markets like gridlock. They got gridlock.
Democrats swept both chambers on Tuesday. The President said he would accept the result and work with them. On Wednesday the Dow added 1,569 points — 3% — its biggest single day following any midterm election since 1982. Oil fell more than 8%, yields dropped, precious metals rallied, and consumer sectors led.
Then on Thursday technology dragged the market straight back down. The relief lasted one session. The rotation underneath was specific rather than broad: data-centre and AI names were sold hard on expectations of construction moratoriums, with some neocloud names off more than 7%. Defence and prison operators lagged. Consumer discretionary led.
And the fact that belongs here: across the past seven decades, the US market has been higher six months after every midterm election. That is a seasonal pattern tied to a political calendar rather than a shipping season — the same kind of claim we make weekly, and subject to the same caveat. Nineteen elections is a small sample, and history is not a promise.
We unlock one window on each board and gate the rest. Here is where the last two we opened currently stand, marked to Thursday's close.
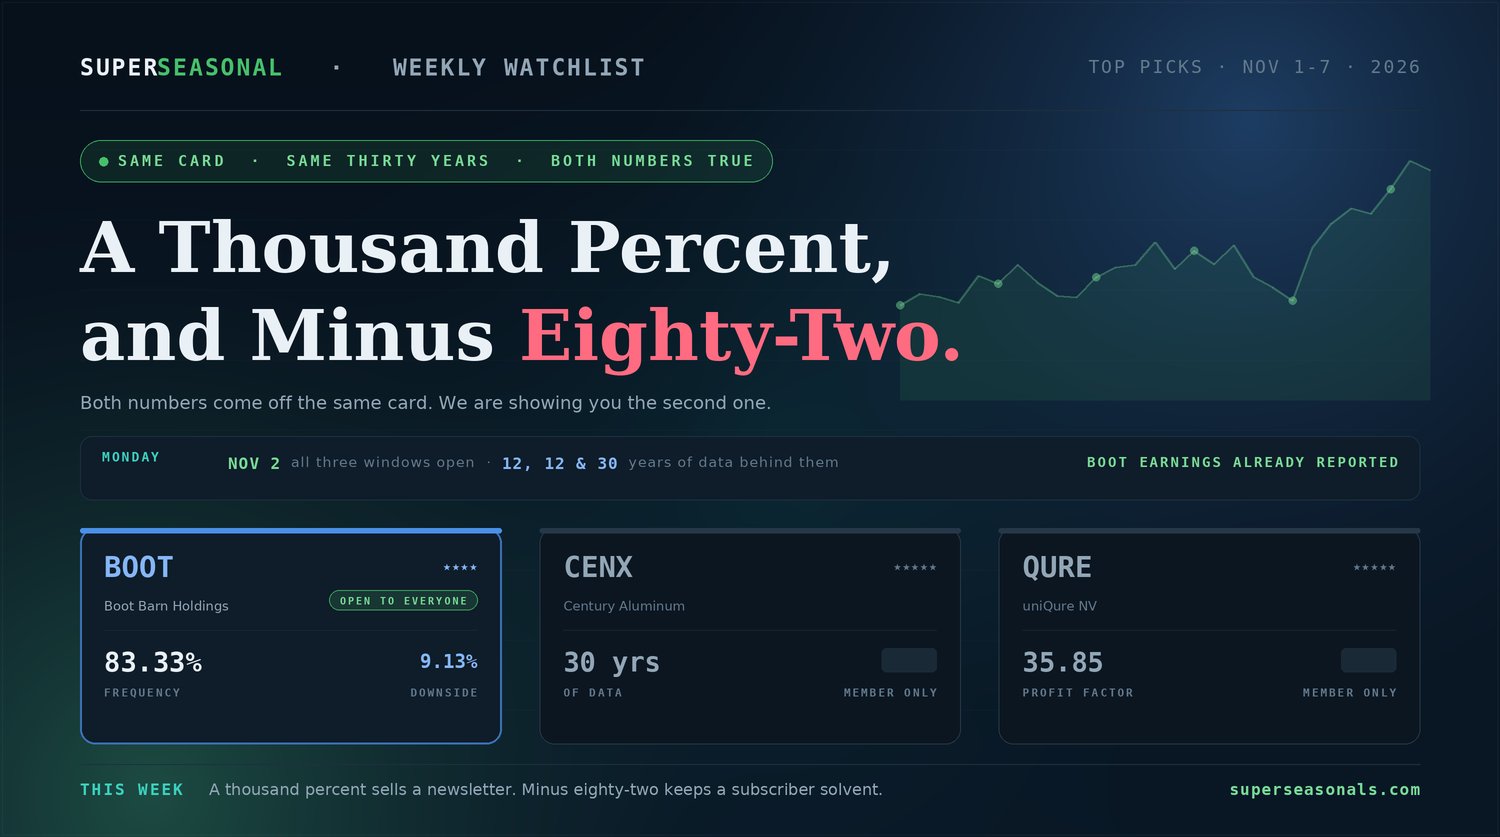
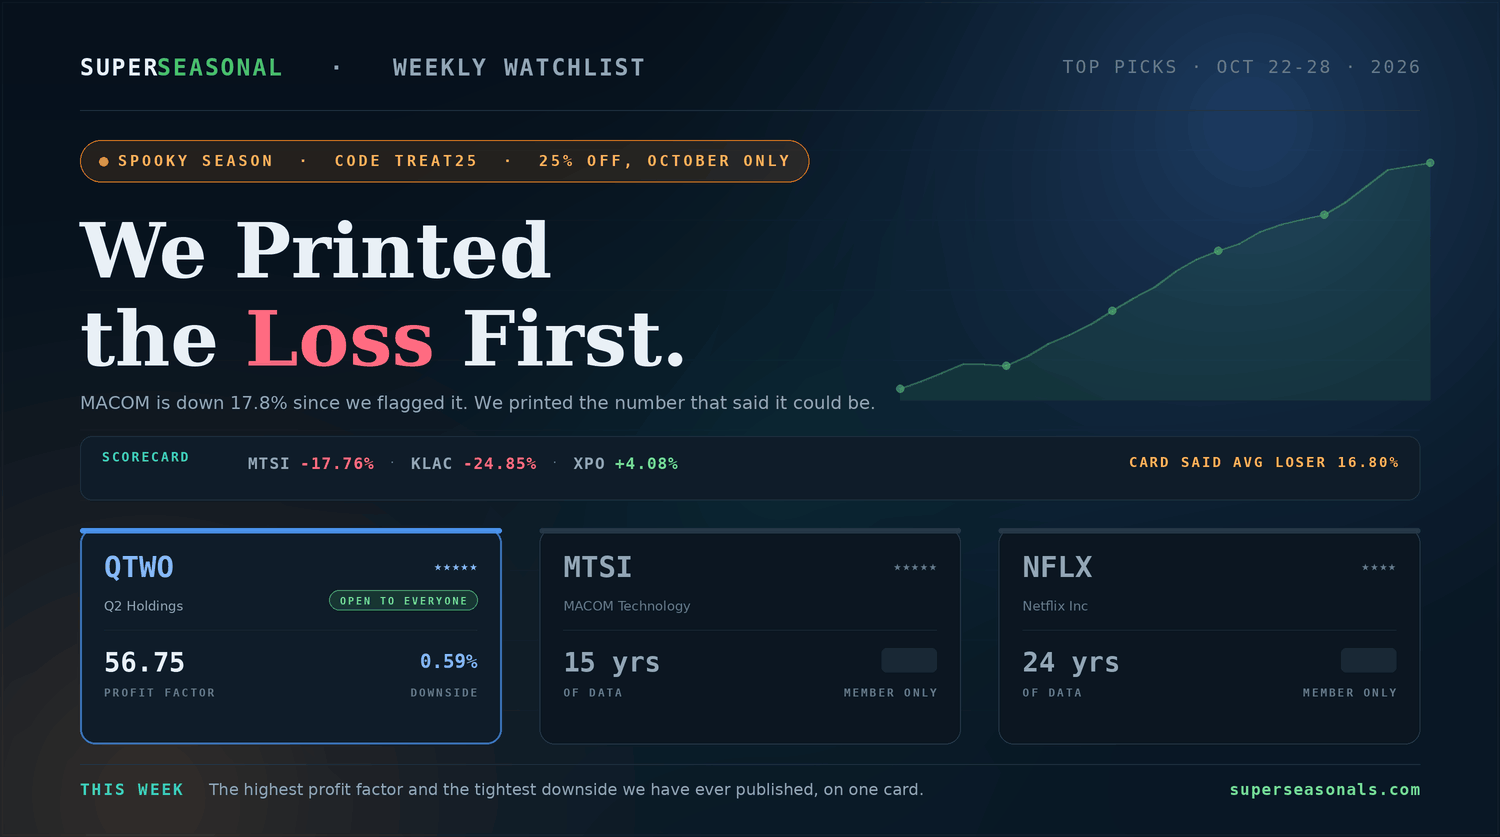
QTWO — published October 22 at $69.62. Thursday: $75.62, up 8.62% in two weeks, on a window running to November 12. BOOT — published November 2 at $130.62. Thursday: $138.59, up 6.10% in three sessions, on a window closing November 24.
Both are still open, and three days and two weeks are not results. We will mark them again when they close, whichever way they go.
Meanwhile the window we gated last week — the one whose card carried a worst year north of fifty percent — is down roughly 11% since Monday, with earnings reported Thursday evening. That is the same system working in the other direction. The number that said it could do that was printed before it did.
Figures reference publicly reported closing prices on the dates stated. They are not a representation of subscriber results and exclude commissions, fees and slippage.
Forty-five Novembers — the deepest record we have ever carried
Home Depot has been listed since 1981, and the scanner has watched this same stretch of November and early December every year since. Forty-five years — the deepest record this newsletter has ever carried. It beats the 36-year window we published in October, which was itself a record when we ran it.
Now read the bottom band against the top one, because this is the unusual part. A sample that long normally has something ugly buried in it — a crash year, a crisis, a quarter that broke the pattern. This one has a 2.91% downside sigma, an average losing move of 5.82% and a worst year of -11.48%. Four and a half decades of November, and the bad ones were mild.
The timing is not purely calendrical this year. Home improvement retail sits inside the consumer discretionary sector that led Wednesday's post-election rally, the biggest single day after any midterm since 1982. Oil falling more than 8% that same session feeds straight into freight and input costs for a business that moves enormous volumes of heavy, bulky inventory. And a divided government is generally read as reducing the odds of disruptive new legislation.
First, check the earnings date before you enter. Home Depot has historically reported third-quarter results in mid-November, which would place the print inside this 21-day window. Confirm the confirmed date rather than relying on the pattern. Second, an 80% frequency is solid rather than exceptional, and it is the joint-lowest figure on this board.
Home improvement is directly geared to housing and household credit, both of which are rate-sensitive. The offsets are falling oil, a consumer sector that just led the market higher, and four and a half decades of evidence that this particular stretch of the calendar has been kind.
HD is the longest-running window we have ever published and one of the most contained: 45 years, a 72.73% annual win rate, and a 2.91% downside sigma. The caveats are a frequency that is merely good and an earnings print that probably lands inside the hold — verify the date.
Thirty years, in the sector the election went against
Thirty years of history on an aerospace and defence manufacturer, with a 72.41% annual win rate — the second-highest on this board — and an 80% frequency.
It also carries the lowest profit factor here at 3.95, which is the pairing the Word of the Week below exists to explain: this is the window that wins most often and makes the least per dollar risked.
And the news is not helping. Defence names were among the groups that lagged Wednesday's rally after the Democratic sweep of both chambers. The seasonal pattern and the political read are pointing in different directions this year, which is precisely the situation the downside band was built for.
Both dates, the upside and downside bands, the catalyst, the risk flags and the bottom line continue inside Super Seasonal.
Nine years, and the second-biggest profit factor we have published
Nine years of data — the shallowest record on any board we have published. And attached to it, a profit factor of 27.37, the second-highest figure this scanner has ever returned, alongside an 88.89% frequency.
Note the annual win rate sitting beside it: 60.00%, the lowest of the three. A window that wins less often than the one above it, with a profit factor seven times larger. The Word of the Week below uses these two cards to explain exactly how that happens.
It is also the longest hold on this board by a wide margin, running into the new year.
Both dates, the upside and downside bands, the catalyst, the risk flags and the bottom line continue inside Super Seasonal.
The three, side by side
| Ticker | Rating | Years | Freq. | Profit Factor | Annual Win % | Worst Drawdown | Downside Σ |
|---|---|---|---|---|---|---|---|
| HDHome Depot · unlocked | 5 / 5 | 45 | 80.00% | 6.36 | 72.73% | -20.00% | 2.91% |
| WWDWoodward Inc | 4 / 5 | 30 | 80.00% | 3.95 | 72.41% | -00.00% | 0.00% |
| XPELXPEL Inc | 4 / 5 | 9 | 88.89% | 27.37 | 60.00% | -00.00% | 0.00% |
That part is simple. Here is the part that trips people up, and this week's board demonstrates it better than any explanation could.
Profit factor is not a win rate. The two can point in opposite directions, and on this board they do.
The first window wins more often. The second wins by far more when it wins — enough that a lower success rate still produces a ratio of gains to losses roughly seven times better. Both numbers are true. Neither one tells you the other.
Why it matters when you are sizing a position:
- High win rate, low profit factor often means small frequent gains and occasional large losses — the shape that quietly empties accounts while looking successful on a win/loss tally.
- Lower win rate, high profit factor means you will be wrong more often and should plan for it. It demands a position size you can hold through a losing streak without flinching.
- Profit factor says nothing about the worst single outcome. A window can carry a strong ratio and still contain one year that halved. That is a separate question, and it is what the downside band answers.
Treating a high profit factor as a measure of safety. It is a measure of efficiency — how much you were paid per unit of pain. A window can be highly efficient and still put you through a drawdown you cannot sit through. Read it with the annual win rate beside it, and both of them with the downside band underneath.
One number has never been enough. That is the entire reason there are twelve on every card.
Where the Word of the Week runs out.
Profit factor tells you how much you were paid per unit of pain across the sample. The downside band tells you how much pain to expect. Between them, they answer how big a position should be.
What neither of them answers is how to build the position in the first place.
Take the window opened above. A -20% worst drawdown is a number you can plan around with shares, or a number you can cap outright with the right structure. Whether a drawdown is something you ride out or something you never fully take on is not decided by the forecast — it is decided by how the position was built.
Ryan Jones runs this live in December. Dates, format and pricing are on the page.
See the December WorkshopSeparate from your SuperSeasonals membership. Options involve significant risk and are not suitable for every investor; read the Characteristics and Risks of Standardized Options before trading. See the page for current dates, pricing and terms.
The Big Picture
Forty-five years, thirty years, and nine — opening the same Monday morning.
Three windows, three completely different kinds of evidence. Forty-five years of mild outcomes. Thirty years of frequent small wins. Nine years of rare large ones. A star rating flattens all of that into four symbols, and a frequency figure flattens it further.
Which is why the Word of the Week above matters more than usual this week: the window that wins most often is the one that pays least per dollar risked, and both of those facts are sitting in plain sight on the same board.
Super Seasonal Trade Desk