Ninety-Two Years
of October.Week of October 8 · XPO · KLAC · RCL
Three windows opened Thursday carrying 23, 36 and 33 years of history between them — the deepest board we have ever published. All three close within three days of each other.
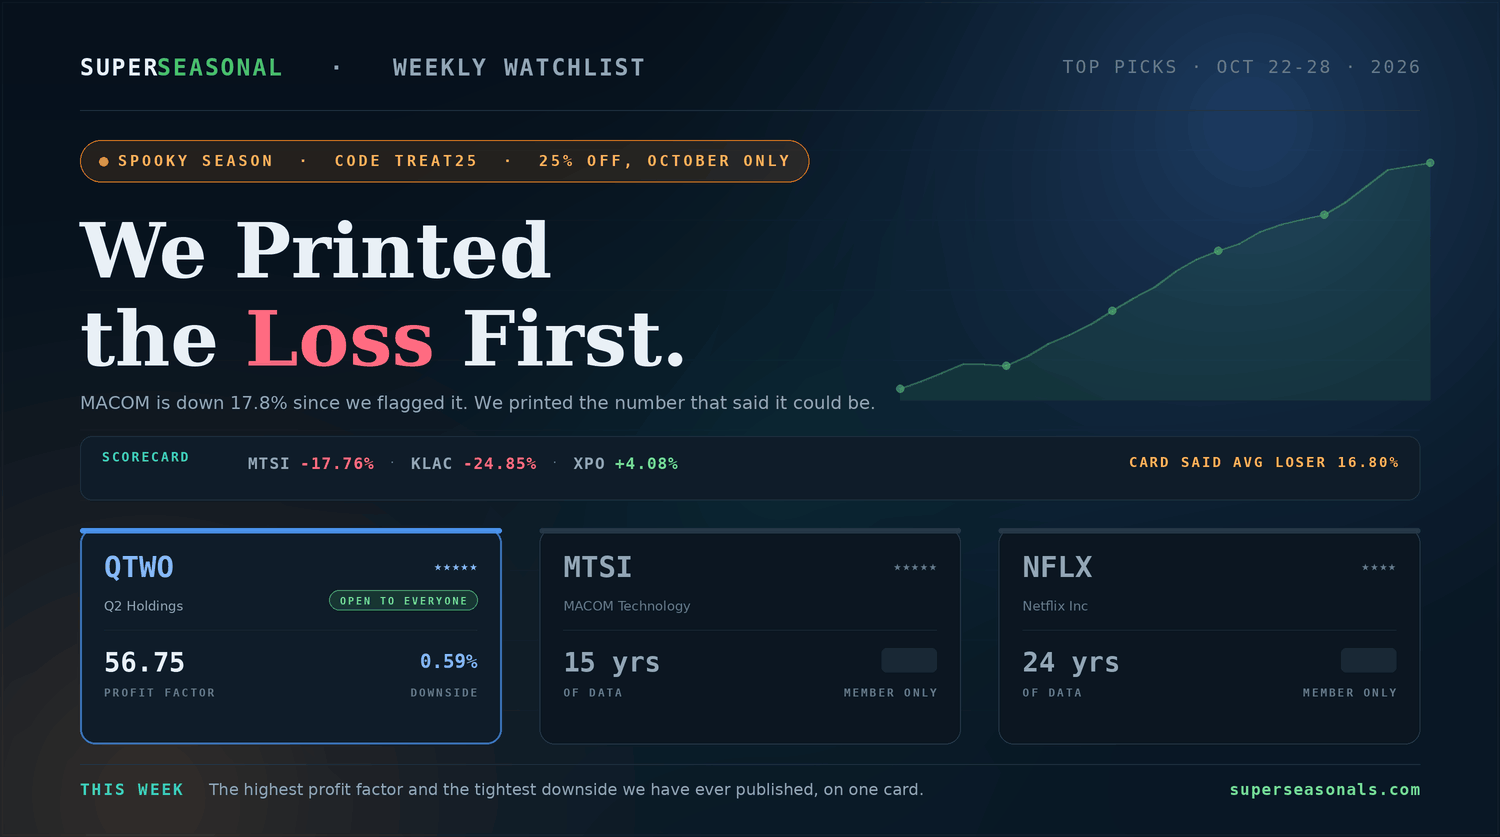
Three we published recently, marked to Thursday's close. MACOM (MTSI) — published September 29 at $288.29, closed Thursday at $330.75, up 14.73% in nine days. XPO — published September 29 at $175.53, closed at $181.95, up 3.66%, and back on this board with a new window. Planet Fitness (PLNT) — published September 22 at $50.16, closed at $41.85, down 16.57%.
We print the third for the same reason we print worst-year and worst-drawdown on every card. PLNT's write-up gave its deepest closing drawdown in eleven years as -13.22%. It is now past that. Anyone who sized against that number is uncomfortable. Anyone who sized against the 90.91% frequency alone is not. That is the argument for the downside band, and we would rather make it with a real loss than a hypothetical one.
Figures reference publicly reported closing prices on the dates stated. They are not a representation of subscriber results and exclude commissions, fees and slippage.
No cuts on the board through 2027
The Fed raised rates on September 16 for the first time since 2023 — unanimous, 12–0, to 3.75%–4.00%. Sixteen of eighteen participants expect at least one more hike this year, four pencilled in two, and the median shows roughly 4.1% at year end and again through 2027.
That means no cuts projected at all over the forecast horizon, futures implying about 4.3% by December, and long-dated yields near twenty-year highs. The next decision lands October 27–28 — and two of these three names report earnings in those same 48 hours.
The strongest row — and the one you have seen before
XPO leads this board on the measures that matter most together: the best profit factor at 7.66, the tightest downside at 4.91% sigma, the smallest average losing move at 8.15%, the best efficiency score and the biggest average move per trade. On a risk-adjusted basis nothing else here is close.
It is also a name you have seen recently. We published XPO on September 29 at $175.53 on a window running to December 17. It closed Thursday at $181.95 — up 3.66% — and the scanner has now selected it again on a separate, shorter window.
Read that carefully if you are already in it. The September window is still open. This is a second window on the same name, not a signal to add. Treat it as confirmation to hold through the original exit, not as a reason to double your position size.
The business underneath remains a structural story rather than a cyclical one. Yellow's bankruptcy permanently removed less-than-truckload capacity, and that supply reset is what hands XPO pricing power. Second-quarter adjusted earnings came in at $1.70 a share against a $1.47 estimate.
Across 26 analysts the average target sits near $232 against a price around $182. Bernstein initiated at Outperform with a $244 target, framing the thesis as a structural supply reset rather than a demand recovery; Goldman moved to $247 and Stephens to $270. Citi is the caution at Neutral with a lowered $220.
XPO reports third-quarter results on October 29 — inside this 21-day hold, and one day after the Fed decision. Freight remains deeply cyclical with a demand backdrop still described as muted, and diesel prices have been climbing. The -24.14% worst drawdown is the middle of this board, not the best.
Trucking is a direct read on the real economy, which makes XPO the most cyclically exposed name here. Higher rates slow the freight demand it depends on, while the tightened capacity supports pricing. The Fed matters to this one through the economy, not just the multiple.
XPO is the best risk-adjusted window on the board by a clear margin, on a name already working since we published it nine days ago. The caveats are earnings inside the window, a cyclical end market, and a second window overlapping a position many readers already hold.
Thirty-six years — the deepest record we have ever carried
Thirty-six years of history — the deepest record this board has ever carried, beating the 28-year window we published last week. Five stars, and the strongest annual win rate on this board across that span. It also carries the roughest worst-drawdown figure we have ever printed on any card, and the price will look unfamiliar because the company executed a ten-for-one split in June. Those facts belong on the same page, and members see all of them.
Both dates, all twelve statistics, the catalyst, the risk flags and the bottom line continue inside Super Seasonal.
Thirty-three years, and a sector that just moved without it
Thirty-three years of history, four stars, and the longest hold of the three. It is also the only name here whose entire sector repriced double digits in a single week — on a competitor's earnings report, not its own. Its own print lands on day one of the Fed's two-day meeting. Whether that is a reason to take it or a reason to leave it is the whole write-up.
Both dates, all twelve statistics, the catalyst, the risk flags and the bottom line continue inside Super Seasonal.
The three, side by side
| Ticker | Rating | Years | Freq. | Profit Factor | Hold | Worst Drawdown | Downside Σ |
|---|---|---|---|---|---|---|---|
| XPOXPO · unlocked | 5 / 5 | 23 | 82.61% | 7.66 | 21d | -24.14% | 4.91% |
| KLACKLA Corporation | 5 / 5 | 36 | 00.00% | 0.00 | 00d | -00.00% | 0.00% |
| RCLRoyal Caribbean | 4 / 5 | 33 | 00.00% | 0.00 | 00d | -00.00% | 0.00% |
The board gives you a date. A live room gives you the follow-up question.
A window hands you an entry, an exit and a downside figure. What it cannot do is answer “why that structure, why that size, and what would make you pass?” That is what a live session is for.
Ryan runs it live in November. Dates and details are on the page.
Save Your SeatSeparate from your SuperSeasonals membership. Trading involves risk, including the possible loss of principal. See the page for current dates, pricing and terms.
The October offer is live now.
Puddle Jumper's October deal is running, and it does not carry past the month. If it has been on your list, this is the window.
Full terms, inclusions and pricing are on the page.
See the October DealSeparate from your SuperSeasonals membership. Trading involves risk, including the possible loss of principal. See the page for current dates, pricing and terms.
The Big Picture
Ninety-two years of history across three windows, and twenty-one days to use it.
Two things make this week unusual. The first is depth: 23, 36 and 33 years — ninety-two years of evidence on one board, the most we have ever put in front of you. The second is concentration: all three holds are 21 or 22 days and all three close within three days of each other.
And notice what a star rating still cannot tell you. The deepest record on this board carries five stars — and the worst drawdown on the page. Stars measure how much evidence stands behind a pattern. They say nothing about what it costs when the pattern fails, and sizing requires the second answer.
Super Seasonal Trade Desk