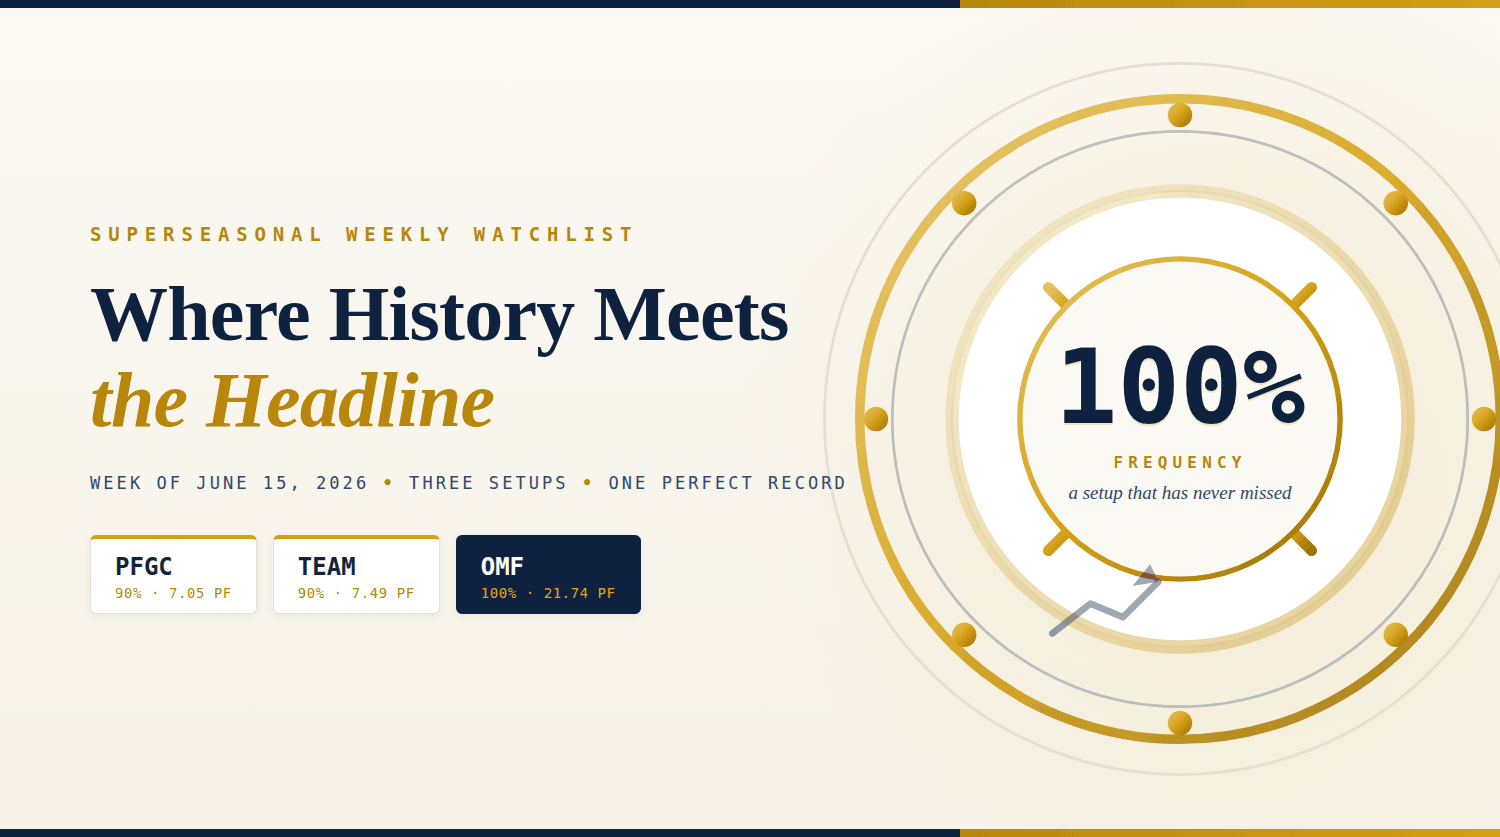
Where History Meets the Headline
Week of June 15, 2026 • Three Setups • One Perfect RecordThis week's scan surfaced a setup that has never missed.
Most weeks, a strong seasonal pattern means 85–93% frequency and a profit factor in the 5–7 range — the kind of stats that anchored last week's list. This week, OneMain Holdings (OMF) printed a 100% historical frequency with a 21.74 profit factor and a 91.25% annualized return. In every historical instance of this calendar window, the stock has finished higher — and when it wins, it has historically won nearly 22 times what it loses.
The tape is still being carried by the AI capital-spending engine, but the gap between winners and losers keeps widening. Software is a split-screen all on its own — names that prove an AI story get paid, names that don't get punished hard. Meanwhile the consumer remains stretched-but-spending, keeping both staples distributors and consumer lenders in play while everyone watches credit data like a hawk.
When the index grinds higher but individual stocks get treated this differently, stock-by-stock catalysts matter more than broad exposure — exactly the environment where seasonality earns its keep.
Performance Food Group PFGC
Momentum at all-time highs with a fresh guidance raisePFGC is the steady-hand setup — higher in 90% of historical instances with a 7.05 profit factor, meaning the wins in this window have historically dwarfed the losses by roughly seven to one. The 73.9% annualized return says this pattern hasn't just worked often; it's worked meaningfully.
The business is about as unglamorous as edges get: a foodservice distribution giant founded in 1885, moving everything from proteins and frozen food to snacks and convenience-store goods across restaurants, healthcare, schools, and c-stores nationwide.
Live CatalystPFGC just punched through the $100 mark. The latest quarter beat on both lines — adjusted EPS of $0.80 against a $0.78 forecast on $16.29 billion in revenue versus the $16.16 billion estimate — and management raised full-year fiscal 2026 revenue guidance while leaning into alternative food technology and sustainable proteins. The stock is up roughly 11% year-to-date with nearly all of it coming in the past month.
Caution FlagThe move has stretched the multiple. PFGC trades near 47x earnings — well above the consumer retailing industry average around 18.5x — and insiders have logged 27 sells and zero buys over the past year. Momentum is real; so is the price tag.
A beat, a raise, and a breakout to triple digits, layered on a 90% seasonal frequency and a 7x profit factor. The quiet compounder setup — let the trend work, but respect the valuation if momentum stalls.
Atlassian TEAM
Best fundamentals it's printed in years — worst stock price in yearsTEAM brings a 90% frequency and a 7.49 profit factor into a stock that has been absolutely hammered — and that's the whole point of this setup. When a strong calendar window opens into maximum pessimism, the asymmetry can get interesting.
Atlassian makes the collaboration software — Jira, Confluence, Trello — that runs inside most engineering organizations on earth, and it's racing to bolt AI onto all of it.
Live CatalystThe fundamentals just inflected. The latest quarter crushed expectations — EPS of $1.75 against a $1.33 estimate, a 31% surprise, with revenue of $1.79 billion topping the $1.70 billion forecast — and management raised the annual revenue growth outlook to roughly 24% from 22% on strong cloud and AI feature adoption. Gross margin hit 87%, an eight-quarter high, as GAAP operating income turned positive for the first time.
Caution FlagThe stock can't get out of its own way. TEAM just suffered a six-day losing streak totaling roughly -18%, erasing about $5.3 billion in market cap, and remains down about 41% year-to-date even after a recent bounce. That gap between improving fundamentals and a brutalized chart is the dislocation contrarian seasonal traders hunt — but it cuts both ways.
The strongest profit factor of the two 90%-frequency names, a genuine margin inflection, and a raised outlook the market is refusing to pay for. The contrarian growth setup — powerful stats meeting peak pessimism, with the volatility to match.
OneMain Holdings OMF
100% frequency and the biggest stats on the boardOMF owns this list statistically. A 100% frequency — higher in every historical instance of this window — paired with a 21.74 profit factor and a 91.25% annualized return. Those aren't seasonal-edge numbers; those are stacked-deck numbers. The 70% annual win rate is the one tempering stat: calendar years can still finish mixed, but within this specific window, history hasn't missed.
OneMain is the leading nonprime consumer lender — personal loans, auto finance, and credit cards for the borrower banks won't touch.
Live CatalystThe stock is showing signs of life after a rough stretch — back-to-back rallies of 3.5% and 3.2% in the past week, lifting shares toward $56 against a GuruFocus fair-value estimate of $58.21. Under the hood, the business is performing: Q1 2026 delivered diluted EPS of $1.93, up from $1.78 a year ago, on $26.1 billion in managed receivables, with a $1.05 quarterly dividend (a yield north of 7% at current prices) and roughly $105 million in buybacks during the quarter.
Caution FlagThis is a sentiment battleground. The stock is down about 22% year-to-date amid legal overhang, insider selling, and pressure across nonprime lending, and the bear case centers on credit quality if the economy softens. The setup is strongest-on-paper precisely because the market hates it right now.
A perfect historical frequency, a 21.74 profit factor, a 7%+ dividend cushion, and a stock starting to bounce off undervalued territory. The statistical anchor of the week — but size it knowing nonprime credit is the live wire.
Three different doors into the same favorable calendar window.
The quiet compounder — beat-and-raise momentum at all-time highs, with valuation as the watch item.
The fallen-growth contrarian — record margins and a raised outlook trapped inside a stock down 40%+ on the year.
The perfect-record anchor — the biggest stats we've ever featured on this scan, attached to the most hated chart.
That spread mirrors the market itself: rewarded momentum on one side, punished value on the other, and a stretched consumer connecting all three stories. A food distributor, a software giant, and a consumer lender — nothing in common except a calendar edge and a live headline. That's the point. When the index is selective, diversified catalysts beat concentrated conviction.
The goal is never to predict the week perfectly. The goal is to walk in prepared, with an edge. Seasonality gives you the roadmap; the job is to watch the price action, manage your risk, and refuse to let emotion make the decision for you.