In today’s Super Seasonals: Trade of the Week we will look at Amazon.com Inc (AMZN).
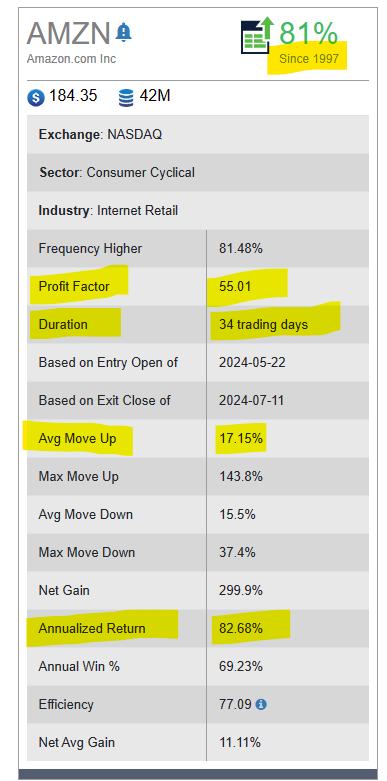
Below is the seasonal snapshot of AMZN…

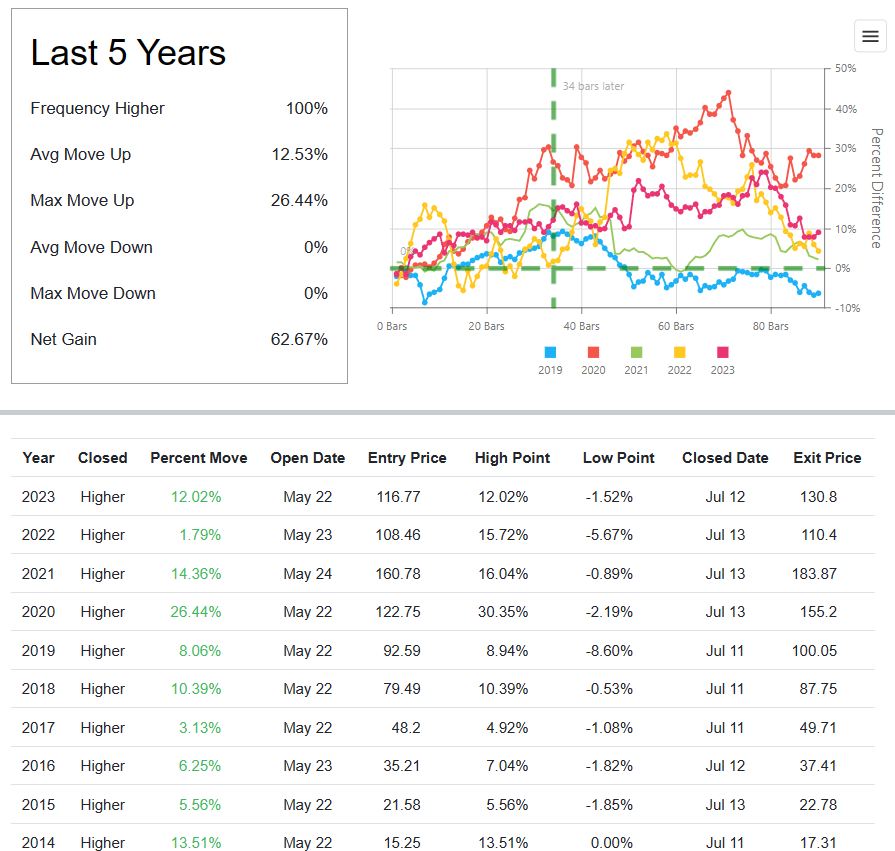
From a recency bias standpoint, If we look at the past 5-10 years, we see that the seasonal tendencies appear to remain valid.

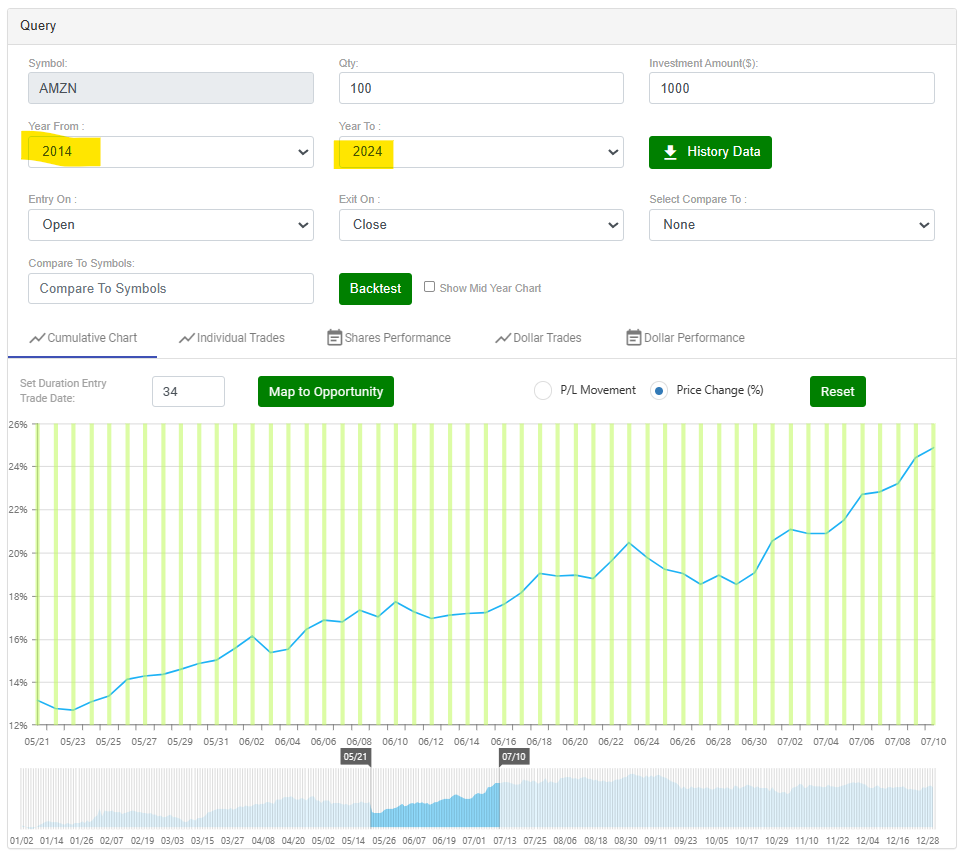
A 10-year look at the Cumulative Chart of the upcoming seasonal period…

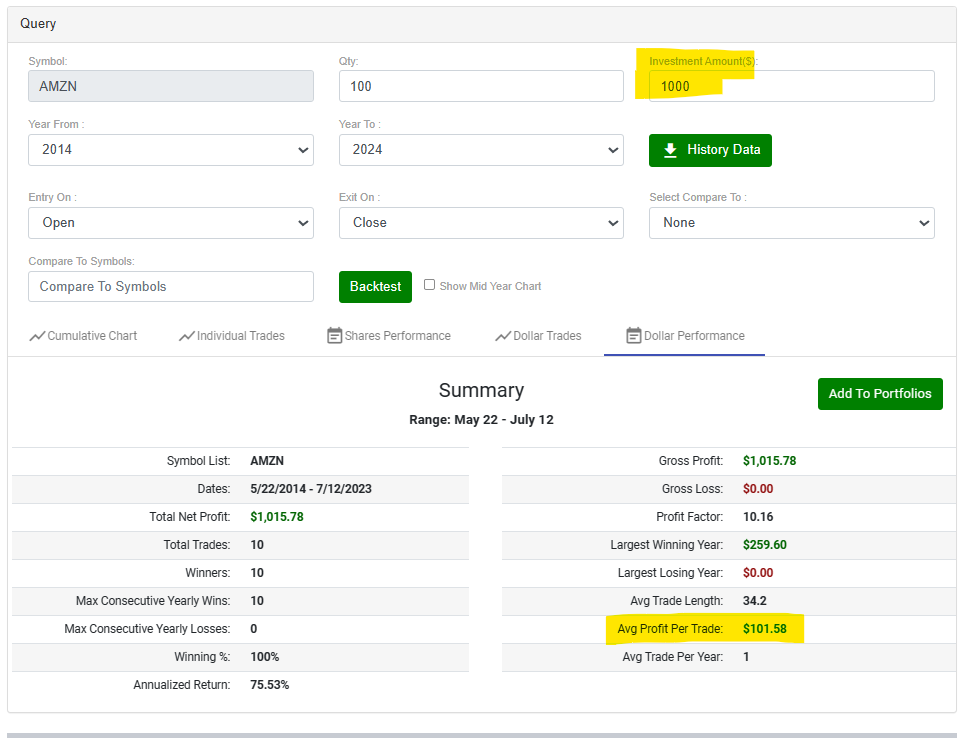
Below is a 10-year backtest if one invested $1,000 per trade, it would have profited $101.58 per trade on average over roughly a 6-week trading period.

As you likely know, there are literally dozens of solid ways to approach trading Amazon.com Inc (AMZN) with a bullish bias. The decision of how to best invest in the stock or trade the options is an individualized decision, unfortunately there is no one best way. Keep in mind that seasonality is about probabilities, not certainties. Please remember, do your homework, and fully understand the risk before trading anything.
To learn more about seasonal information on Amazon.com Inc (AMZN) and other solid seasonal opportunities click here SuperSeasonals .
Trade Smart,
Chad Shirley


