(3 Trades for the Week of Feb 9)
If you’ve ever wondered how some traders seem to “know” when certain stocks wake up…
It’s not luck.

It’s oftentimes the calendar quietly pulling strings — weather-driven demand, inventory cycles, supply bottlenecks, and investor behavior that repeats far more often than most people realize.
This week, your seasonal dashboard is flashing one clear theme:
Energy + Gold.
Below are 3 high-probability seasonal candidates from my filtered criteria on the Super Seasonals software — plus the “why” behind the pattern, so you’re not trading blind.
The 30-second market backdrop (so you don’t trade in a vacuum)
Don’t get distracted by intraday noise. What matters into the week is the next 5–15 trading days:
1) Risk-on vs. risk-off (the market’s mood)
When traders feel confident, they chase growth. When they’re cautious, money rotates toward cash-flow, value, and real assets (energy, gold, defensives).
Why it matters: Your best seasonal names fit that “real assets / cash-flow” rotation.
2) Rates + the dollar (the hidden hand)
A firmer dollar and rising yields can pressure growth and whip gold around.
Why it matters: Wheaton Precious Metals (WPM) often does best when rate/dollar pressure eases — while energy can still work if fundamentals stay tight.
3) Rotation beats headlines
Most weeks aren’t “up” or “down”… they’re rotating. When leadership shifts toward commodities/value, seasonal edges in those groups often get extra tailwind.
4) Volatility = position size
When volatility rises, even good patterns get messier.
Rule of thumb: smaller size, wider berth, fewer “all-in” bets.
Bottom line: This is a week to prioritize seasonal edges that align with macro flows (energy + real assets), and keep sizing conservative if volatility stays elevated.
This week’s Top 3 seasonal candidates
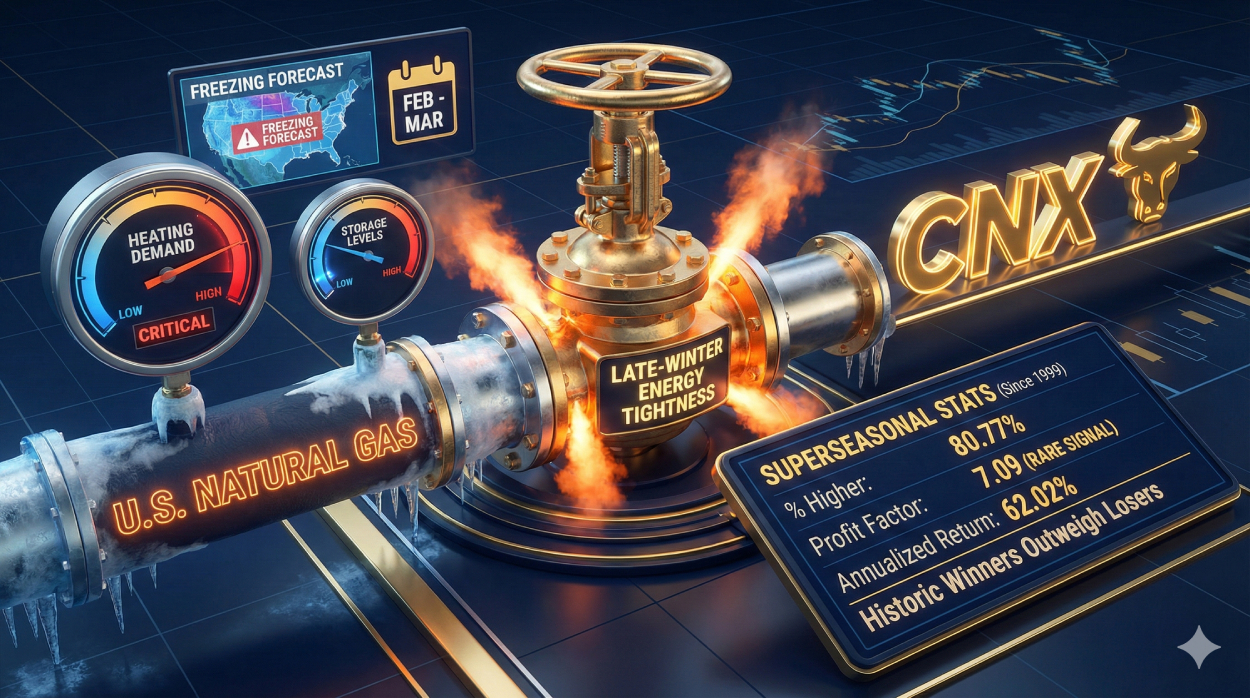
The seasonal “why”: CNX is tied to U.S. natural gas. Late winter is when a small weather shift can trigger an outsized move — because traders obsess over heating demand, storage levels, and forecast changes.
SuperSeasonal stats for the upcoming Entry/Exit window:
- Data since: 1999
- % of years higher: 80.77%
- Profit factor: 7.09
- Annualized return: 62.02%
- Avg daily volume: ~2M
Beginner takeaway: That profit factor is the kind of “signal” you don’t see often in a liquid stock. Historically, winners outweighed losers by a lot in this window.
Main risk: Warm weather forecasts (or a sharp risk-off tape) can spoil it quickly.
The seasonal “why”: This time of year, markets often begin shifting from “winter demand” to “spring/summer runway.” Combine that with energy’s supply/refining rhythms and you often get repeatable price behavior.
CNQ also tends to attract “quality energy” money when traders want cash-flow + durability.
SuperSeasonal stats for the upcoming Entry/Exit window:
- Data since: 2000
- % of years higher: 88.00%
- Profit factor: 3.06
- Annualized return: 61.86%
- Avg daily volume: ~8M
Beginner takeaway: Not the most explosive… but very consistent and very liquid — a combination that matters in choppy tapes.
Main risk: A sharp crude selloff or broad sector underperformance.

The seasonal “why”: WPM behaves like gold exposure with equity torque. Around this part of the calendar, gold can get a boost from a mix of physical demand rhythms and macro narrative swings (rates, dollar, risk appetite).
Gold is the market’s “confidence indicator.” When investors get uneasy, gold-linked names can catch a bid fast.
SuperSeasonal stats for the upcoming Entry/Exit window:
- Data since: 2005
- % of years higher: 80.00%
- Profit factor: 2.98
- Annualized return: 49.31%
- Avg daily volume: ~2M
Beginner takeaway: This is your diversifier — aligned with the “real asset” theme, but not dependent on the same drivers as energy.
Main risk: Dollar spikes / hawkish rate repricing can pressure metals.

About timing
Per our email format, we don’t publish exit dates here.
To see the exact window timing and full backtest details, log in to SuperSeasonal.com.
Trade well,
Chad Shirley
Quick risk disclaimer
This is educational research on historical seasonality—not financial advice. Seasonality can help stack odds, but risk management keeps you in the game. Remember: the market doesn’t owe us a repeat just because the calendar says so.