In today’s Super Seasonals: Trade of the Week we will look at T-Mobile US, Inc (TMUS).
T-Mobile US, Inc. engages in the provision of wireless communications services under the T-Mobile and MetroPCS brands. It offers postpaid and prepaid wireless voice, messaging and data services, and wholesale wireless services.
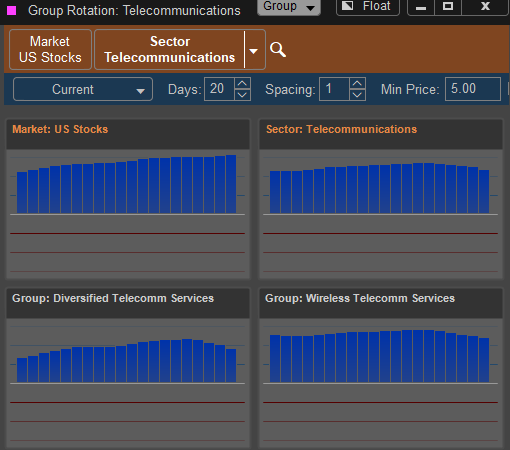
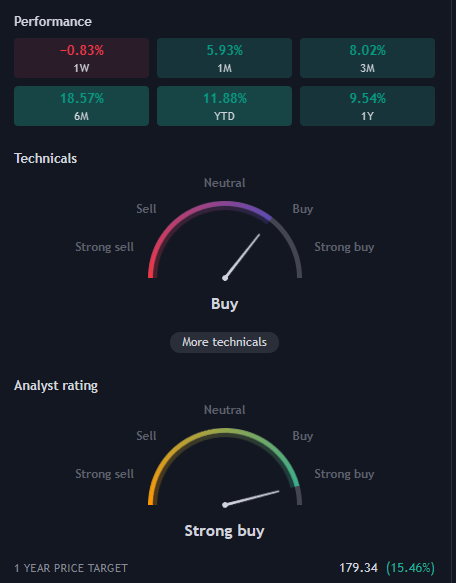
The broad U.S. Stocks have been on a bullish run of late. T-Mobile has followed on a run of late, along with the telecommunications sector and the wireless telecom services industry. In my opinion, which means little versus the broad market, my belief is that it might cool off in the near term. It might pause, and then continue higher into Q1 of next year. The current composite technical ratings are a buy, and the analysts currently have it as a strong buy over the next 12 months.
What does all this tell us? We have “risk on” the market, with bullish sentiment to support that. Of course, it could all end tomorrow, but we like our odds when these things come into alignment.
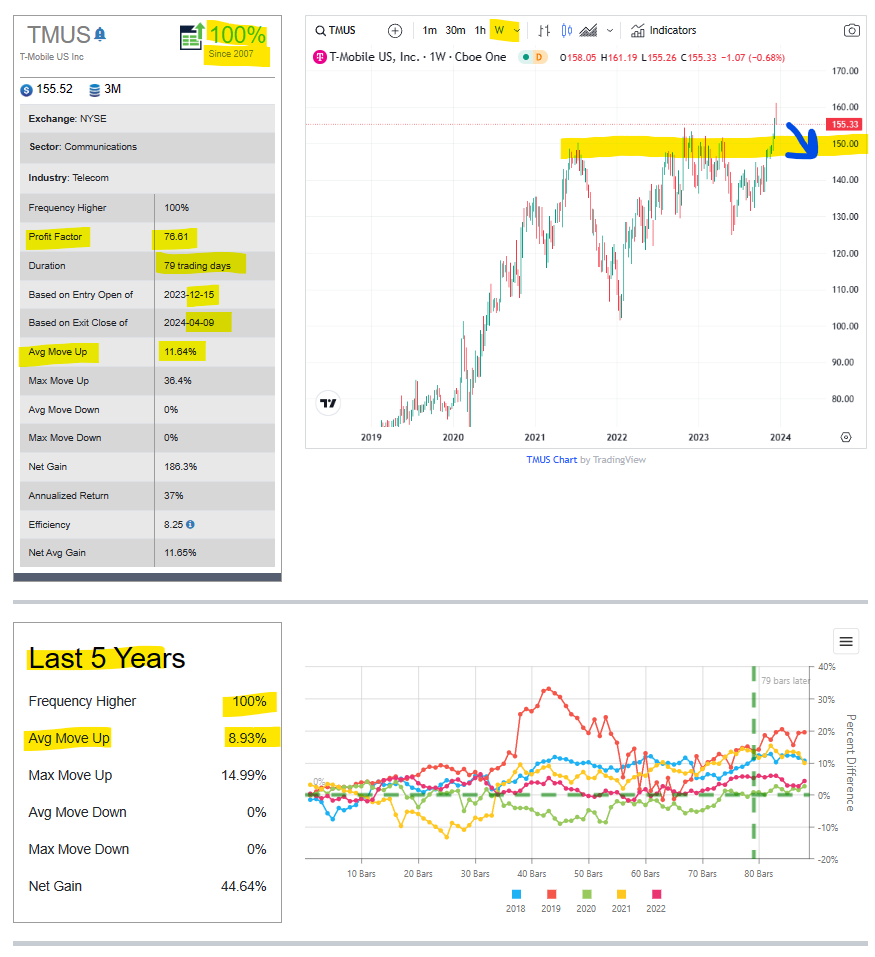
Below is a small snippet of the seasonal stats of T-Mobile…over the next 4 months, 100% winners since 2007.
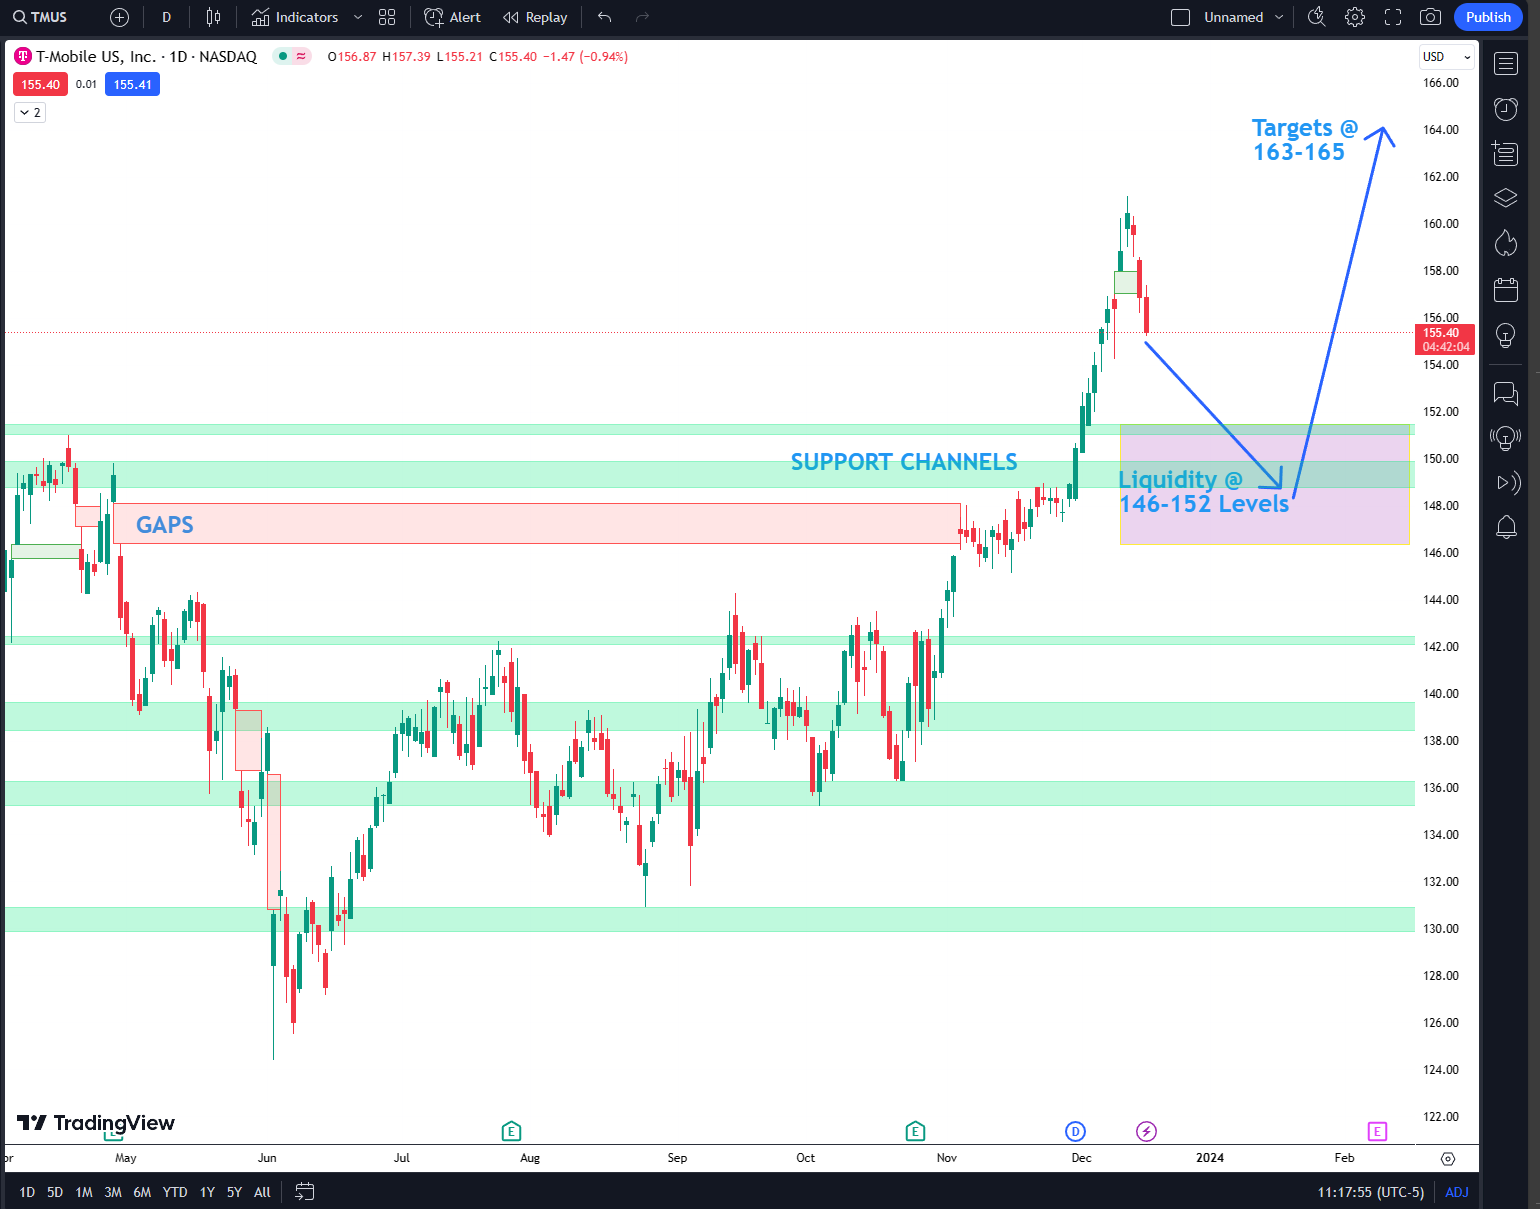
There’s a half dozen ways I could discuss how to play this trade, it’s all trading style dependent, and what an individual’s beliefs are. That said, here’s one way to look at the chart below.
Assuming it’s overbought a bit, and that the stock might pullback and then have a bullish continuation pattern. There’s a couple of good support channels in the 149 to 151 areas. There’s a few gaps in price action if you look back in the 146-149 areas. That said, there might be levels of buy side liquidity that kicks in between the 146-152 levels. That could support a thesis to look for buyside momentum and a pick up in bullish believers volume.
Suppose a bullish believer buys at 149, with an upside target of 164. That’s a potential $15 move in their favor. From a risk perspective, possibly having a stop at 142.50 makes sense, as that’s a $7.50 stop loss, which is a 2 reward to 1 risk trade.
If a reader is fairly bullish now, here’s a potential debit spread to consider…

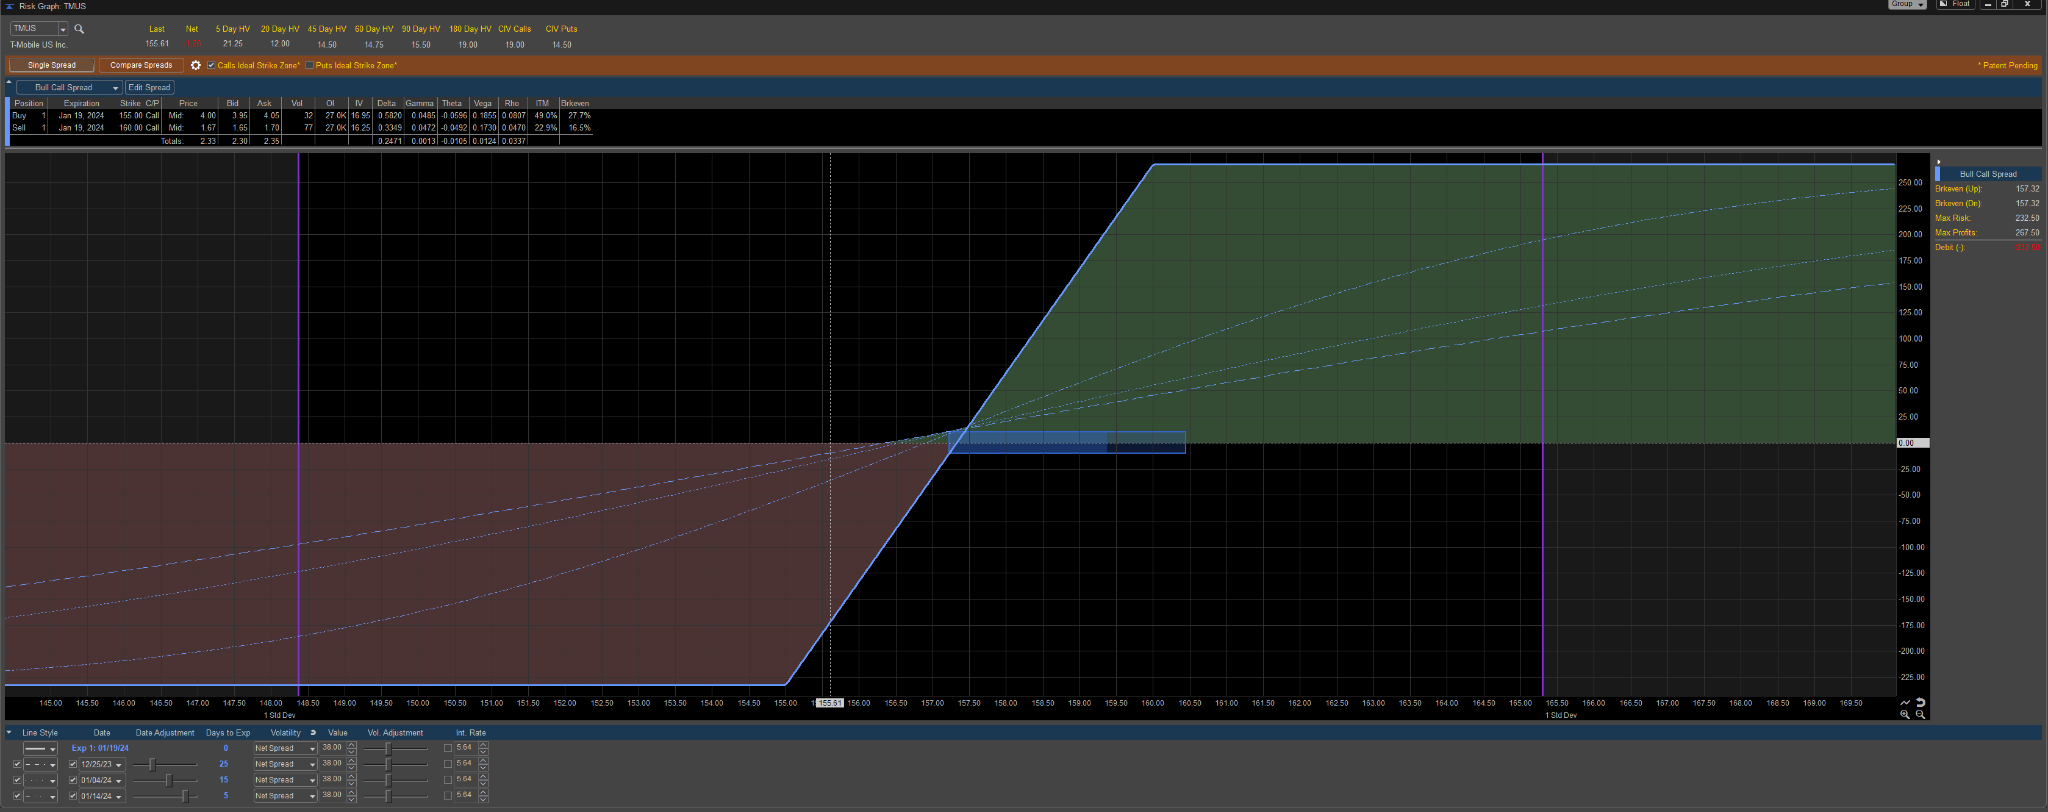
Based on this moment in time. The options market thinks there’s a 67% chance that price “touches” $160 prior to the January 19, 2024 expiration. How do we know that? We take the delta and double it. That’s a rough estimate that’s quick and easy. Remember , that’s based on this moment, if the price sells off, those odds will lower.

As you likely know, there are literally dozens of solid ways to approach trading T-Mobile US, Inc (TMUS) with a bullish bias. The decision of how to best invest in the stock or trade the options is an individualized decision, unfortunately there is no one best way. Hopefully this information has proved worth your time. Please remember, do your homework, and fully understand the risk before trading anything.
To learn more about seasonal information on T-Mobile US, Inc (TMUS) and other solid seasonal opportunities click here SuperSeasonals . For other seasonal opportunities, please click on the link below to access the Super Seasonals software:
CLICK HERE FOR 50% OFF SUPER SEASONAL SCANNER


