In today’s Super Seasonals: Trade of the Week we will look at Southwestern Energy Company (SWN).
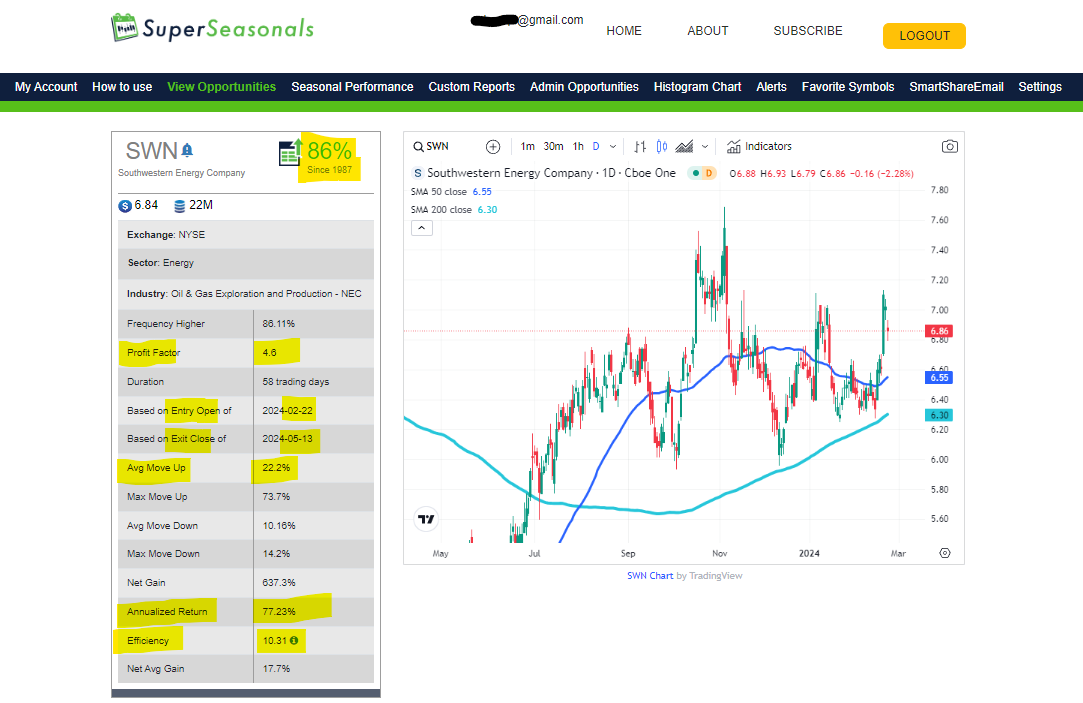
Southwestern Energy Co. is a holding company, which engages in the exploration, development, and production of natural gas, oil, and natural gas liquids (NGLs).
Below are the seasonal stats since 1987. Also there’s a daily chart, showing that price is currently trading above its 50 and 200 day simple moving averages. This signifies a bullish technical tone.
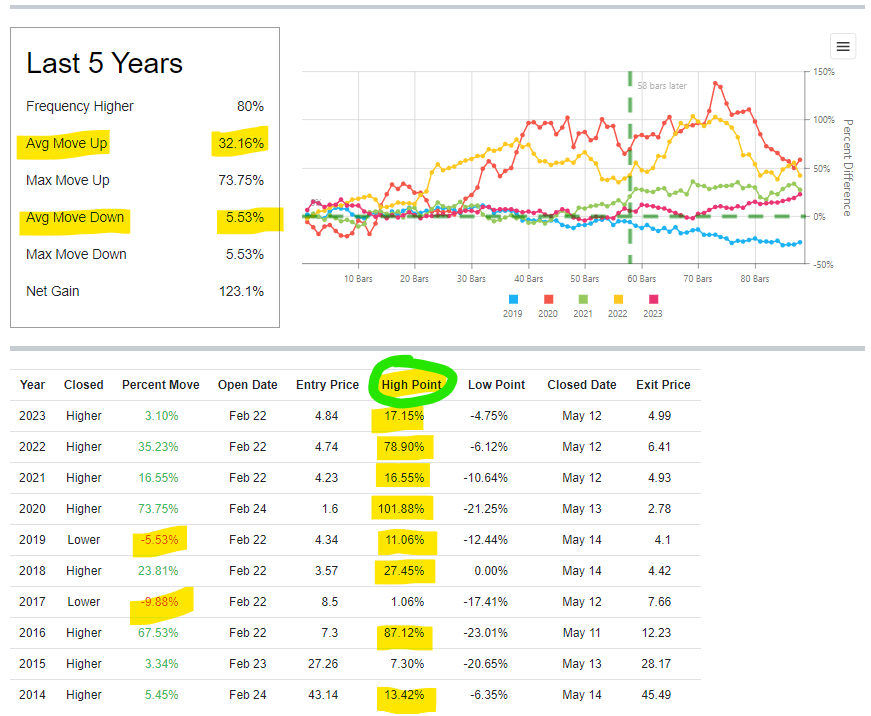
From a recency bias standpoint in the past 5-10 years, the seasonals appear to still be in alignment with the longer term historicals. There have been some real solid High Points, and the Percent Moves that happened during the time duration were relatively small in relationship to the Average Move Up.
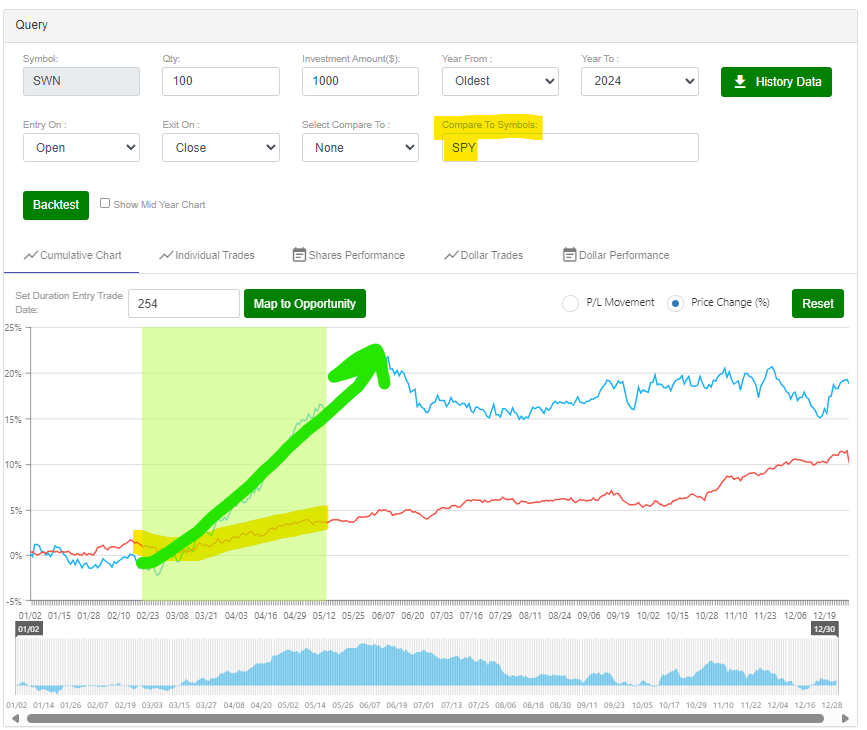
Below is a Backtest of the SWN against the broad market SPY. As you can see, it sticks out like a sore thumb that there is a strong seasonal tendency for the stock during this period. It dwarfs the percentage movement versus the SPY. Worth noting, the SPY has a bullish seasonal drift as well, which is typically good when you see these biases align.
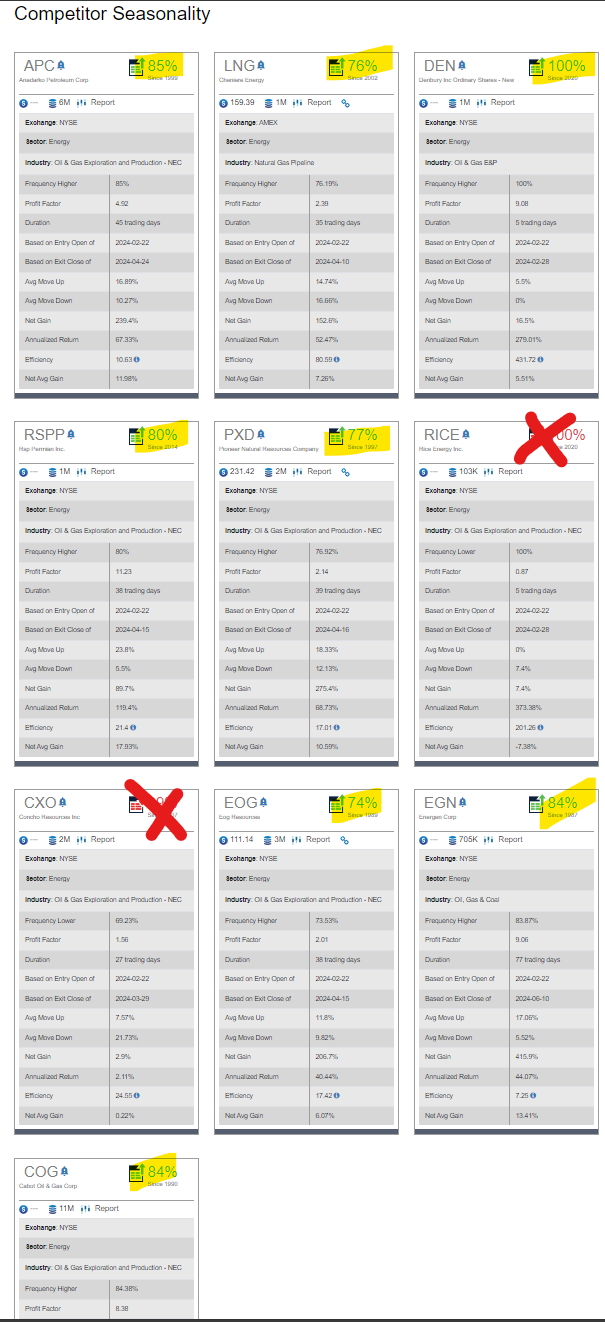
Below are the Competitor Seasonality that the datafeed references. I do not weigh a TON of emphasis on this, as some stocks might be missing or not included on occasion. But it does show a tendency for the industry to have a bullish seasonal START date that is similar to SWN.
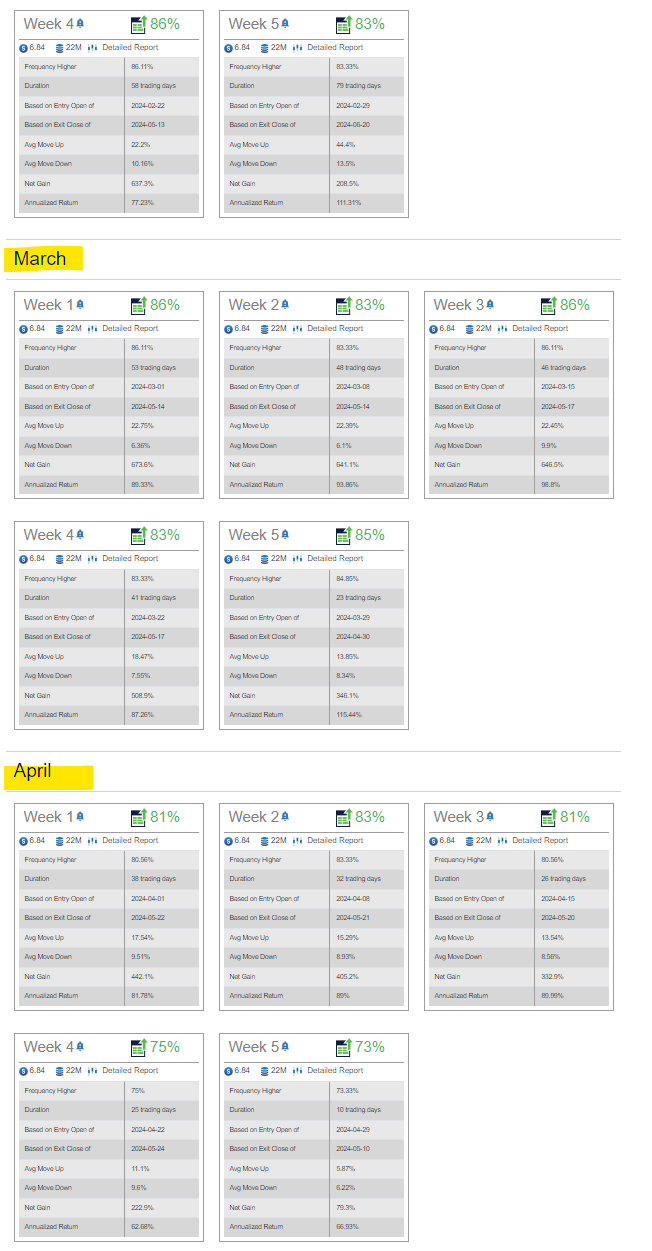
Below are the Week by Week seasonal stats on SWN. As you can see there is a nice bullish tendency to push up over the next couple of months or so.
