In today’s Super Seasonals: Trade of the Week we will look at Skechers USA Inc (SKX).
Skechers U.S.A., Inc. engages in designing, development, and marketing of lifestyle footwear for men, women, and children of all ages.
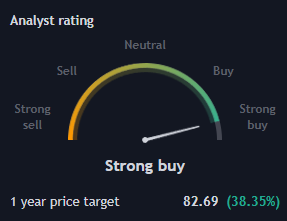
Analysts ratings and 1 year (average) price targets…

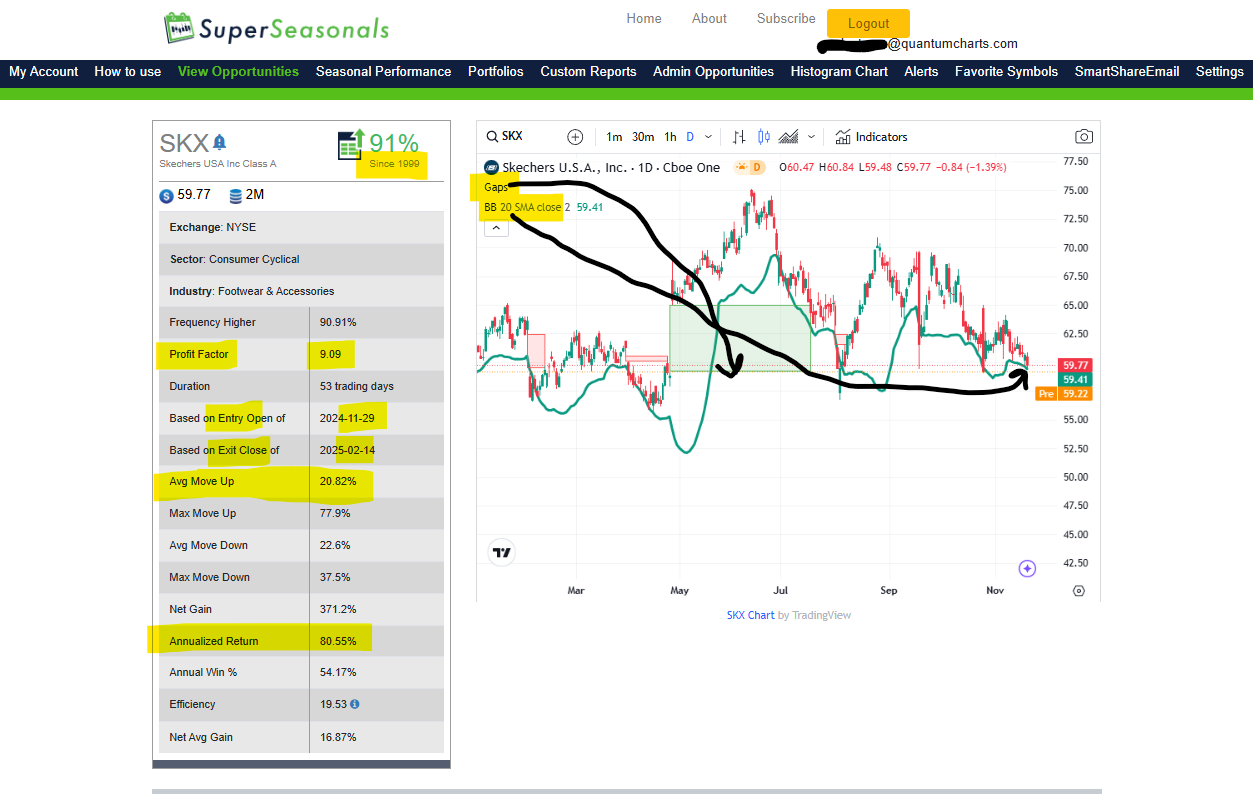
Below are snippets of the seasonal statistics for Skechers in the coming weeks ahead.
Additionally, on the daily chart, price is trading near a previous bullish gap fill area and at the bottom band (green line) of the Bollinger Band indicator. Technically, there appears to be noticeable support levels on the chart…price might attempt to revert up in the near future if these levels hold.

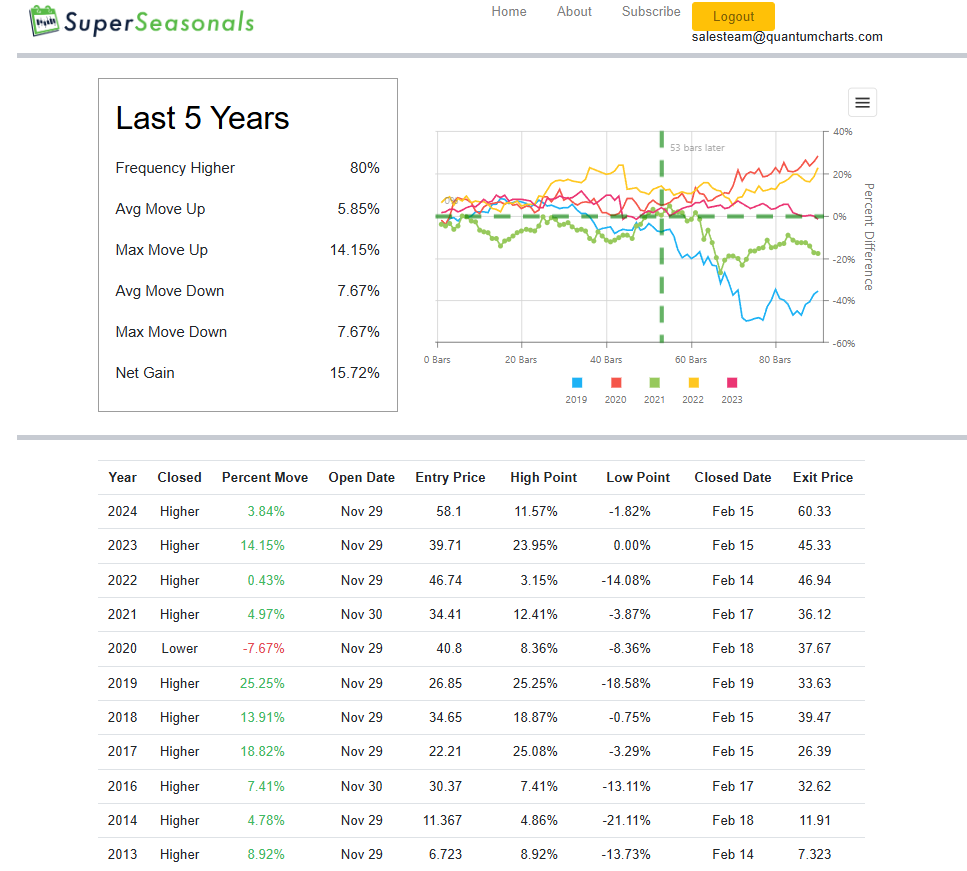
Below is a look at the past 5-10 year periods…A glance at the High Points below, has a “mean” average move of +14% over the next 10 weeks or so of trading.

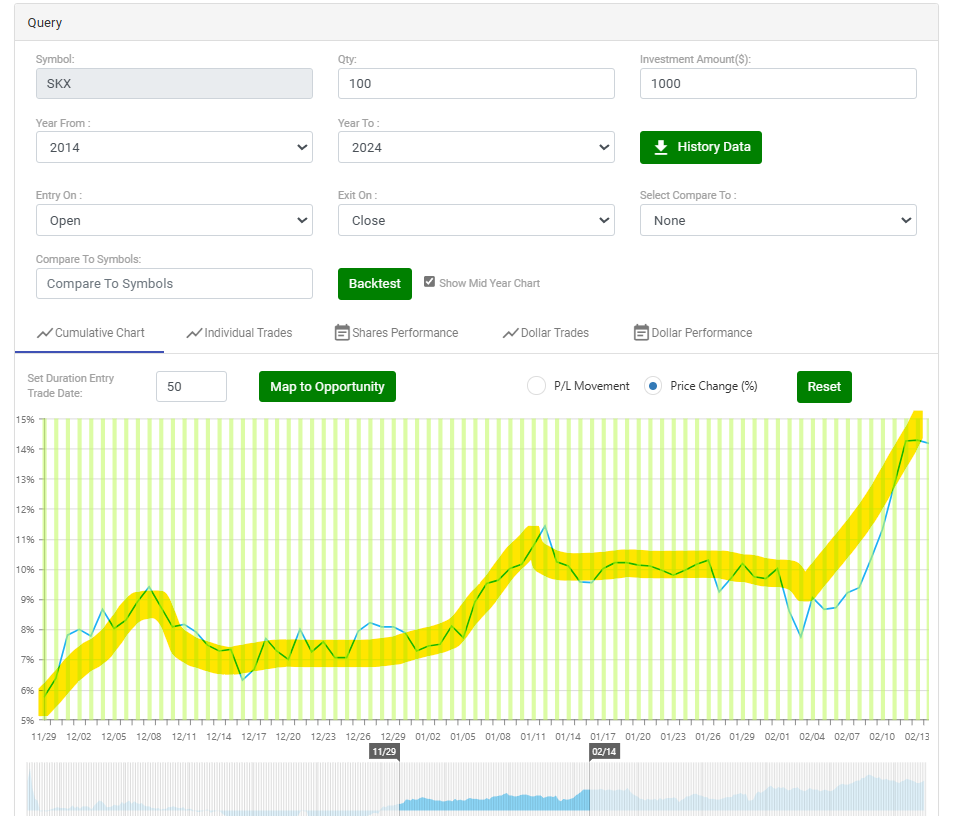
Backtest of the past 10 years…price tends to hold steady with a couple of small up move periods over the next 10 weeks or so…

As you likely know, there are literally dozens of solid ways to approach tradingSkechers USA Inc (SKX) with a bullish bias. The decision of how to best invest in the stock or trade the options is an individualized decision, unfortunately there is no one best way. Keep in mind that seasonality is about probabilities, not certainties. Please remember to fully understand the risk before trading anything. It’s recommended to do your own research and consider consulting with a financial advisor before investing in any stock or options trade.
To learn more about seasonal information on other solid opportunities, click here SuperSeasonals .
Trade Smart,
Chad Shirley


