In today’s Super Seasonals: Trade of the Week we will look at Raymond James Financial Inc. (RJF).
Raymond James Financial, Inc. is an investment holding company, which engages in the provision of financial and investment services. Its services include investment management, merger and acquisition and advisory, the underwriting, distribution, trading and brokerage of equity and debt securities, sale of mutual funds, corporate and retail banking, and trust services. It operates through the following segments: Private Client Group, Capital Markets, Asset Management, Bank, and Other.
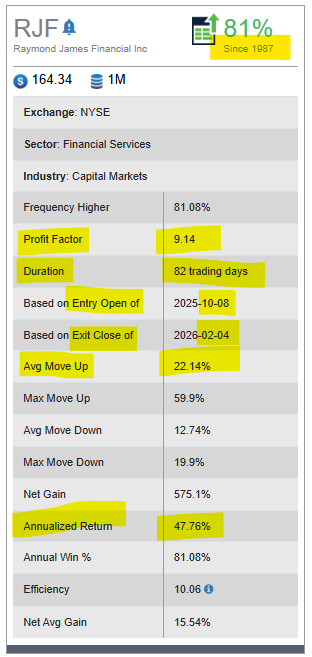
Below is the seasonal pattern that the software uncovered since 1987…

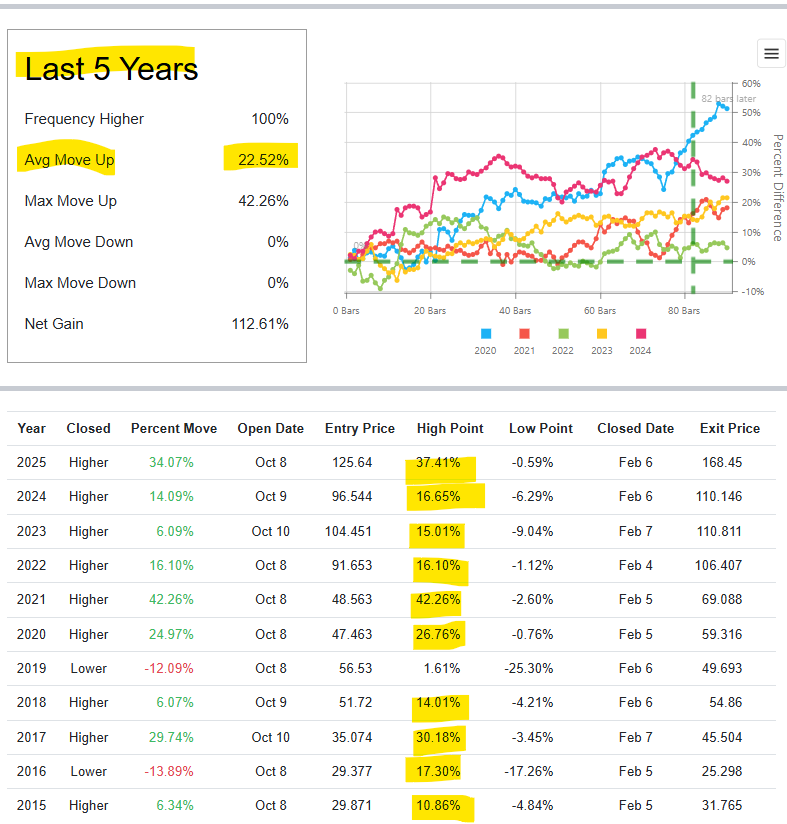
Below is a look at the past 5-10 years over the next 5 months of trading…

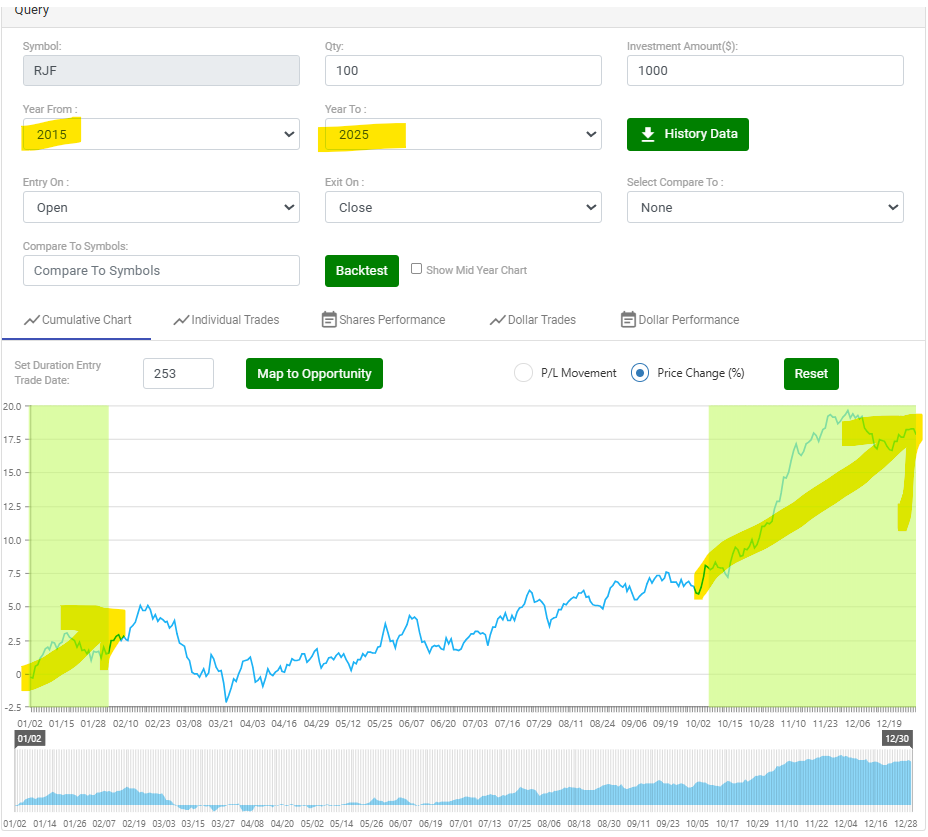
A Cumulative Chart over the past 10 years shows that the pattern certainly stands out visually…

General thoughts…
RJF appears to be a stable, but not exceptional investment at its current price of $164.355 at the time of this writing. The consensus “Hold” rating and modest upside (3.79% to $171.70) suggest it’s not a standout buy unless you’re bullish on the financial sector or see it as undervalued based on its P/E and growth metrics. Consider the following:
- Buy: If you believe in RJF’s long-term growth (e.g., 8.4% revenue growth in 2026) and are comfortable with potential volatility, especially if the stock dips closer to $150.00.
- Hold: If you already own RJF, holding is reasonable given the steady growth and strong financial health, but monitor upcoming Q4 earnings for confirmation of analyst optimism.
- Wait: If you’re risk-averse or seeking a clearer bullish signal, wait for a stronger “Buy” consensus or a better price point, as the stock is near its yearly low but not deeply discounted.
Let’s look at some straight-foward stock buying ideas, if you want to lean on the seasonal patterns along with any other bullish themes you might have…
Are you leaning towards a more immediate entry ?
- Buy Zone: $160–$162
- Stop-Loss: $155
- Take-Profit: $171.70; consider $184 for stronger momentum.
- Monitor: Q4 earnings (late October) and sector flows (XLF +3.1% Q4 avg.). If RJF breaks below $155 or earnings disappoint, reassess the bullish thesis.
Waiting for a pullback?
Action:
- Buy at $155–$160 on a pullback, set stop at $150, and target $171.70 for a 2.1–3.3:1 reward-to-risk.
- Consider a partial exit at $184 if price breaks above $173.
- Monitor earnings and sector flows for confirmation.
Profit Target Areas:
- Primary: $171.70, high-probability exit based on analyst consensus and gap resistance.
- Stretch: $184, for aggressive bulls if Q4 earnings and seasonality exceed expectations.
Stop-Loss Area:
- $150, below key support and analyst low target, with $153 as a tighter alternative for risk-averse traders.
In closing, as you likely know, there are literally dozens of solid ways to approach trading Raymond James Financial Inc. (RJF) with a bullish bias.
The decision of how to best invest in the stock or trade the options is an individualized decision, unfortunately there is no one best way. Keep in mind that seasonality is about probabilities, not certainties.
Please remember to fully understand the risk before trading anything.
It’s recommended to do your own research and consider consulting with a financial advisor before investing in any stock or options trade.
To learn more about seasonal information on other solid opportunities, click here SuperSeasonals.
Trade Smart,
Chad Shirley


