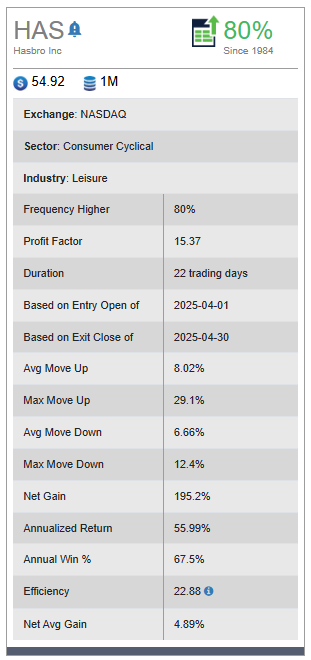
In today’s Super Seasonals: Trade of the Week we will look at Hasbro Inc (HAS).
Hasbro, Inc. engages in the provision of children and family leisure time products and services with a portfolio of brands and entertainment properties.
Below is a seasonal pattern that the software uncovered over the next month of trading…

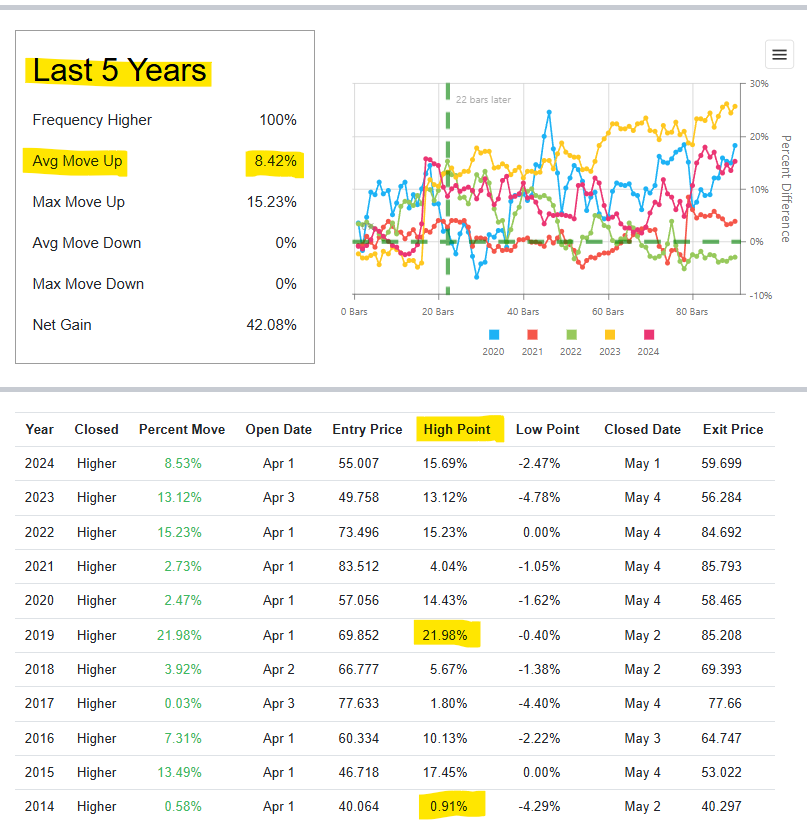
Last 5 year Avg Move Up is 8.42% in 21 trading days, which is solid…Also a 10 year look at the “Mean” High Point is +12% in 21 trading days…

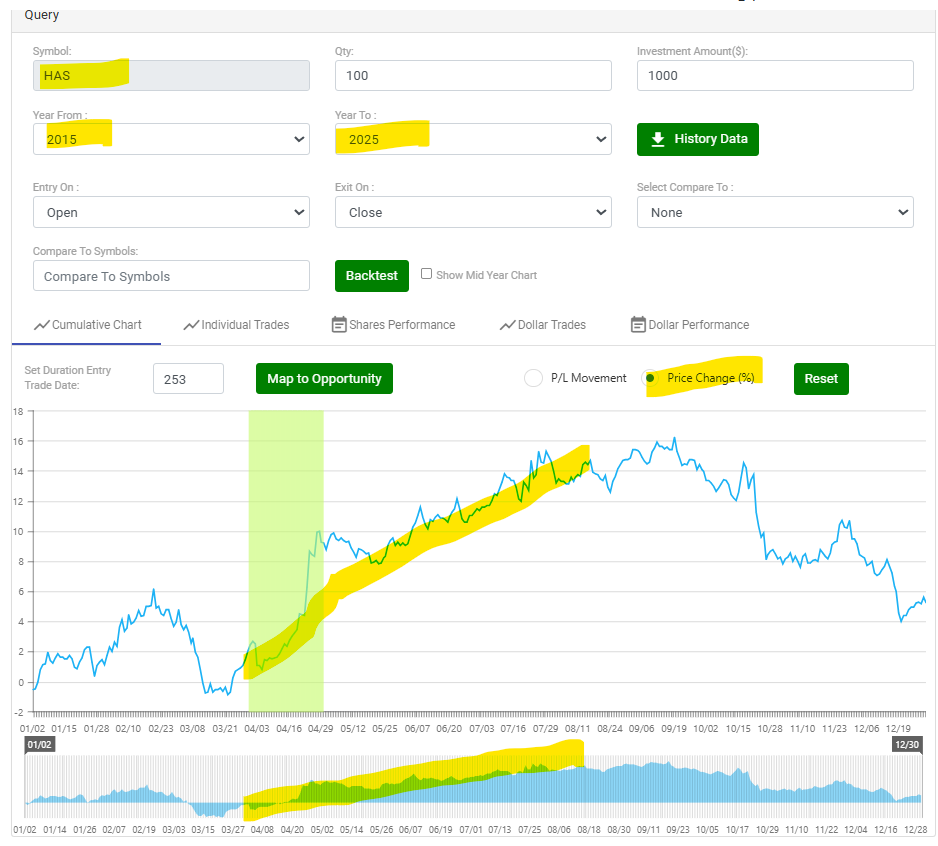
A Cumulative Chart of the average % move in the past 10 years…has a historically extended move toward late July/early August…

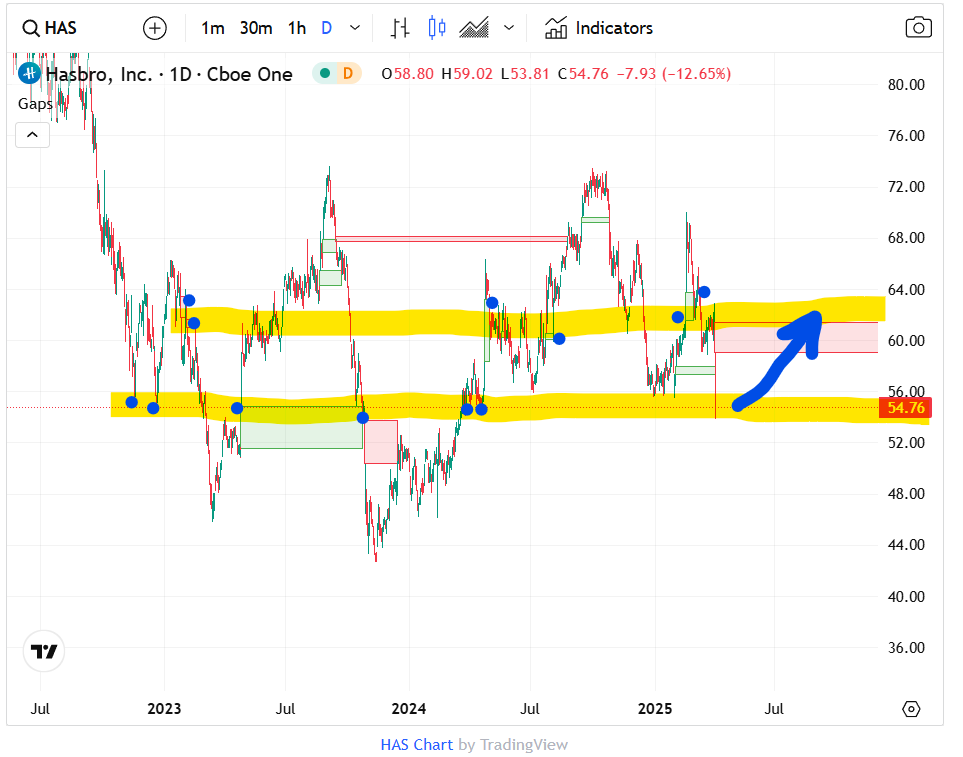
The stock is at an interesting level, around key pivots and price gaps…possibly buyers come in and rotate price to upside area pivot and gap level interests…

As you likely know, there are literally dozens of solid ways to approach trading Hasbro Inc (HAS) with a bullish bias.
The decision of how to best invest in the stock or trade the options is an individualized decision, unfortunately there is no one best way. Keep in mind that seasonality is about probabilities, not certainties.
Please remember to fully understand the risk before trading anything.
It’s recommended to do your own research and consider consulting with a financial advisor before investing in any stock or options trade.
To learn more about seasonal information on other solid opportunities, click here SuperSeasonals.
Trade Smart,
Chad Shirley


