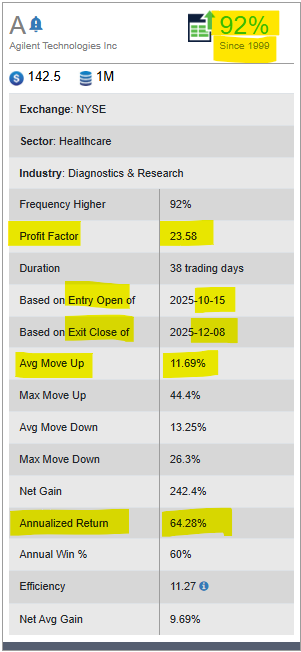
In today’s Super Seasonals: Trade of the Week we will look at Agilent Technologies (A).
Company & Sector Context
Agilent Technologies provides tools for analyzing structural properties of chemicals, molecules, and cells, serving diverse end markets including healthcare, chemical, food, and environmental fields. Over half of sales are generated from biopharmaceutical, chemical, and advanced materials markets, with the company having significant operations in the US and China.
Recent Developments & Analyst Sentiment
Recent analyst activity shows strong bullish sentiment, with multiple firms raising price targets in October 2025. JP Morgan increased its target to $165 from $155, UBS upgraded to Buy with a target raised to $170, and TD Cowen boosted their target to $162. The consensus from 20 analysts shows an average brokerage recommendation of “Outperform” status.
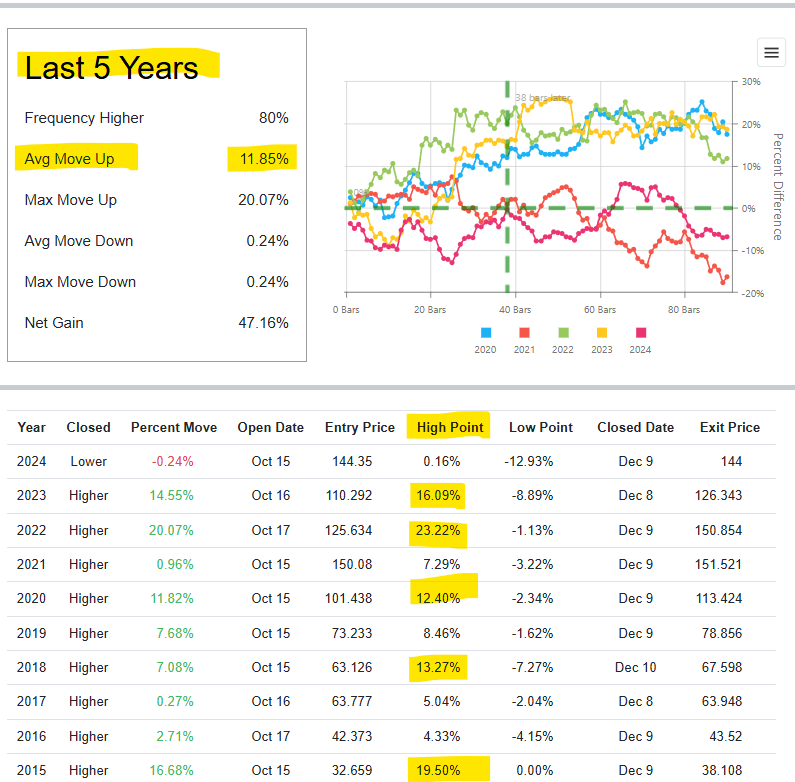
Seasonal Stats

A Look at the Past 5-10 Years…

Trading Scenarios for Agilent Technologies (A)
SCENARIO 1: Pullback/Dip Buying Strategy
Entry Zone (Waiting for Pullback):
- Primary Entry: $138-140 – This is the recent consolidation support where the stock has been basing
- Secondary Entry: $134-136 – If it pulls back deeper, this mid-range support offers better risk/reward
- Aggressive Entry: $132-133 – Strong support from September, maximum pullback before trend breaks
Stop Loss Placement:
- If entering at $138-140: Stop at $135.50 (below support, risk = $3-4.50)
- If entering at $134-136: Stop at $131 (below key support, risk = $3-5)
- If entering at $132-133: Stop at $128.50 (below August consolidation, risk = $3.50-4.50)
Target Areas:
- T1: $148 (initial resistance, +6-10% gain)
- T2: $152 (January highs, +10-13% gain)
- T3: $160-165 (analyst target range, +15-20% gain)
Risk/Reward: Approximately 1:2 to 1:3 ratio, which is favorable
Why This Works:
- Buying dips in an uptrend has higher probability of success
- Better entry price = better risk/reward
- Support zones have proven to hold multiple times
SCENARIO 2: Breakout Strategy
Breakout Entry Zones:
- Primary Breakout: $144.50-145 – Clear break above current resistance with volume
- Confirmation Breakout: $148.50-149 – Break above the January consolidation zone (stronger signal)
Stop Loss Placement:
- If entering at $144.50-145: Stop at $140.50 (back below breakout level, risk = $4-4.50)
- If entering at $148.50-149: Stop at $144 (back below resistance-turned-support, risk = $4.50-5)
Target Areas:
- T1: $152-154 (measured move from consolidation, +5-7%)
- T2: $160-162 (mid-range analyst targets, +10-12%)
- T3: $168-170 (upper analyst targets like UBS’s $170, +15-17%)
Breakout Confirmation Signals to Watch:
- Volume spike – Should be 50%+ above average volume
- Strong close – Close in upper 25% of the breakout candle
- Follow-through – Next day should hold above breakout level
Risk/Reward: Approximately 1:2 to 1:2.5 ratio
Why This Works:
- Breakouts above consolidation often lead to continuation moves
- Analyst targets at $160-170 provide clear upside objectives
- Technical resistance becoming support is a bullish signal
MY PREFERRED APPROACH: Conservative Single-Entry Method (Simplest)
Buy Zone: $135-137
- Entry: $136 (midpoint)
- Stop Loss: $132.00 (below all major support)
- Risk: $4.00 per share
Price Targets by Year End:
- T1: $148 (+8.8%)
- T2: $155 (+14%)
- T3: $165 (+21.3%)
Your Action Plan:
Week of Oct 21-25:
- Set alerts at $138, $136, $134
- DO NOT buy yet – let it test $144-148 resistance first
- Watch for volume and rejection patterns
If it breaks >$148 on huge volume:
- Your setup is invalidated
- Reassess or wait for next consolidation
- DO NOT FOMO chase – maintain discipline
If it rejects at $144-148:
- High probability pullback coming
- Get ready to execute $135-137 entry
- This is your highest-probability scenario (~65%)
If it consolidates $140-144 for 2+ weeks:
- Buy at $140 (earlier than planned)
- Tighter stop at $137
- Smaller position: (1% risk on $3.50 stop)
ALTERNATIVE: If You MUST Be In Now
Compromise Position (Against my PREFERRED APPROACH, but every trader is different):
- Entry NOW: $142
- Stop: $137 (risk = $5)
- Targets: Same ($148, $155, $165)
In closing, as you likely know, there are literally dozens of solid ways to approach trading Agilent Technologies (A) with a bullish bias.
The decision of how to best invest in the stock or trade the options is an individualized decision, unfortunately there is no one best way. Keep in mind that seasonality is about probabilities, not certainties.
Please remember to fully understand the risk before trading anything.
It’s recommended to do your own research and consider consulting with a financial advisor before investing in any stock or options trade.
To learn more about seasonal information on other solid opportunities, click here SuperSeasonals.
Trade Smart,
Chad Shirley


