– SuperSeasonal Weekly Market Edge
– Week of March 9th
Most investors think the stock market moves randomly.
One day it’s inflation.
The next day it’s interest rates.
Then suddenly everyone is talking about AI again.
But when you study decades of market data, a different picture begins to appear.
Certain stocks tend to move at very specific times of the year.
Not because of technical indicators.
Not because of luck.
But because real-world economic forces repeat on the calendar.
Insurance deductibles reset.
Energy demand rises and falls.
Consumer habits follow seasonal rhythms.
When those forces repeat year after year…
market patterns begin to emerge.
Each week we scan the data to identify stocks that are entering these historically strong seasonal windows.
This week, three particularly interesting patterns are beginning to develop.
(For the exact timing windows and full seasonal charts, you can log in to SuperSeasonal.com.)
This Week’s Seasonal Setups
Seasonal Snapshot
- Frequency Higher: 96%
- Profit Factor: 38.7
- Data since: 1996
At first glance, Quest Diagnostics might seem like an unusual stock to show strong seasonality.
But once you understand how the U.S. healthcare system operates, the pattern becomes surprisingly logical.
The Deductible Reset Effect
Every January, millions of Americans reset their health insurance deductibles.
Because of that, many patients delay non-urgent medical testing early in the year while they evaluate healthcare costs.
But by March, that hesitation fades.

Doctors begin scheduling:
- annual physicals
• blood panels
• preventative screenings
• chronic condition monitoring
Quest Diagnostics sits directly in the middle of this diagnostic testing pipeline.
As expectations for testing volume begin to rise, investors often start pricing in improving revenue visibility during the spring months.
Over the past few decades, that shift in healthcare activity has created a remarkably consistent seasonal pattern in the stock.
Seasonal Snapshot
- Frequency Higher: ~87%
- Profit Factor: 12.3
- Data since: 2002
Streaming companies operate on content cycles and subscriber growth waves.
And those waves often show up clearly in the stock market.
Why Spring Matters for Streaming
The period beginning in March historically lines up with:
- major content releases
• rising viewer engagement
• analysts modeling summer subscriber growth
During late winter and early spring, many consumers spend more time at home before the summer travel season begins.
That shift can quietly increase engagement across streaming platforms.

Investors often anticipate those dynamics before subscriber data confirms the trend.
Which helps explain why Netflix has historically shown strong seasonal momentum during this window.
Seasonal Snapshot
- Frequency Higher: ~82%
- Profit Factor: 17.3
- Data since: 2003
When traders think about energy stocks, they usually focus on oil prices.
But electricity markets follow their own seasonal rhythm.
And companies like NRG sit right at the center of that cycle.
The Summer Demand Trade Begins Early
Electricity demand typically rises dramatically during the summer months as air-conditioning usage increases.
But power markets often begin pricing in that demand months in advance.

As winter fades, traders start modeling:
- rising temperatures
• increasing cooling demand
• higher industrial electricity consumption
Another factor is natural gas pricing, which heavily influences power generation costs.
When traders anticipate stronger electricity demand relative to fuel costs, power producers often see improving margin expectations.
Historically, that process has often begun in late winter and early spring, helping drive this seasonal pattern.
Market Seasonality Check
Seasonally speaking, mid-March has historically been an interesting turning point for equities.
Several forces begin aligning around this time of year:
- institutional investors reposition portfolios after early-year volatility
- tax refund liquidity begins entering markets
- earnings expectations for the year become clearer
- momentum traders re-enter after the winter slowdown
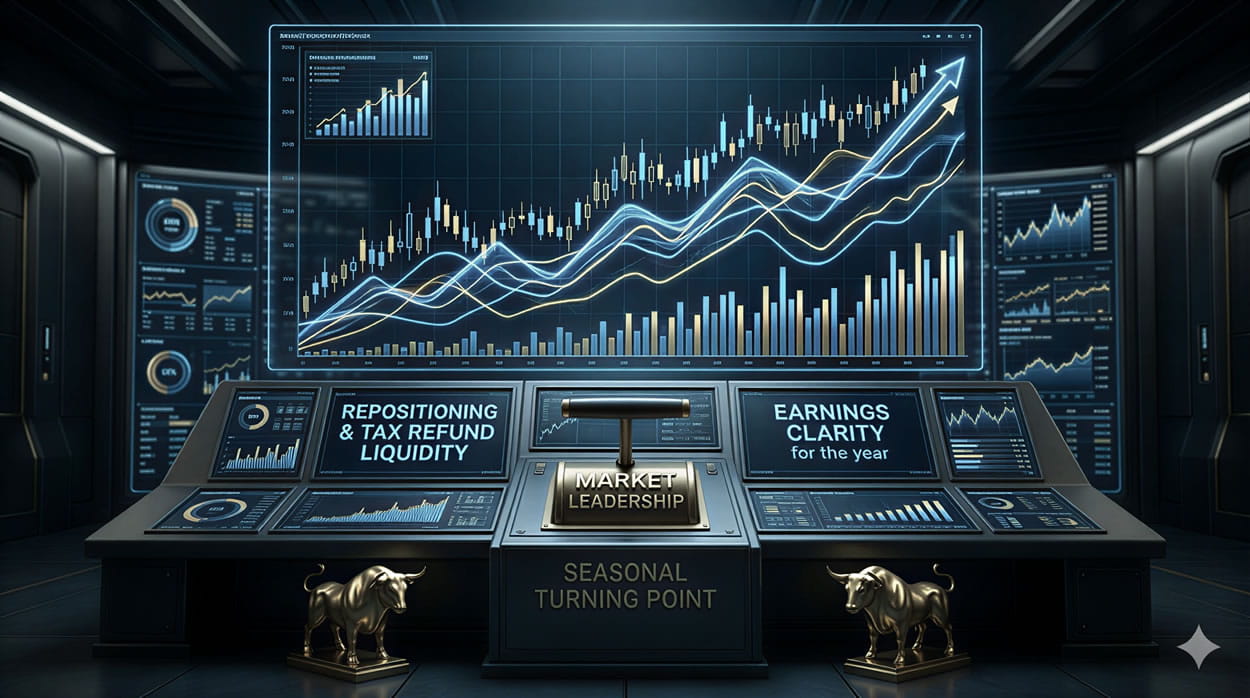
This combination often creates a more favorable environment for growth stocks and selective cyclicals.
It’s one of the reasons we often begin to see new market leadership emerge during the spring months.
Sector in Focus: Healthcare Diagnostics
Healthcare services companies may not get as much media attention as tech stocks.
But they often benefit from predictable demand cycles.
Preventative testing, routine blood work, and diagnostic monitoring tend to increase as the year progresses and patients resume normal healthcare schedules after the holidays.
Companies operating in diagnostic testing—like Quest Diagnostics—often sit directly in the middle of this activity.
That’s one reason healthcare diagnostics stocks occasionally show reliable seasonal strength during the spring months.

Seasonal Insight of the Week
Many seasonal patterns are not driven by the companies themselves.
They’re driven by human behavior.
Consumers travel during the summer.
Retail spending spikes before the holidays.
Energy consumption rises during temperature extremes.
When millions of people make similar decisions at similar times of the year…
financial markets often begin to reflect those patterns.

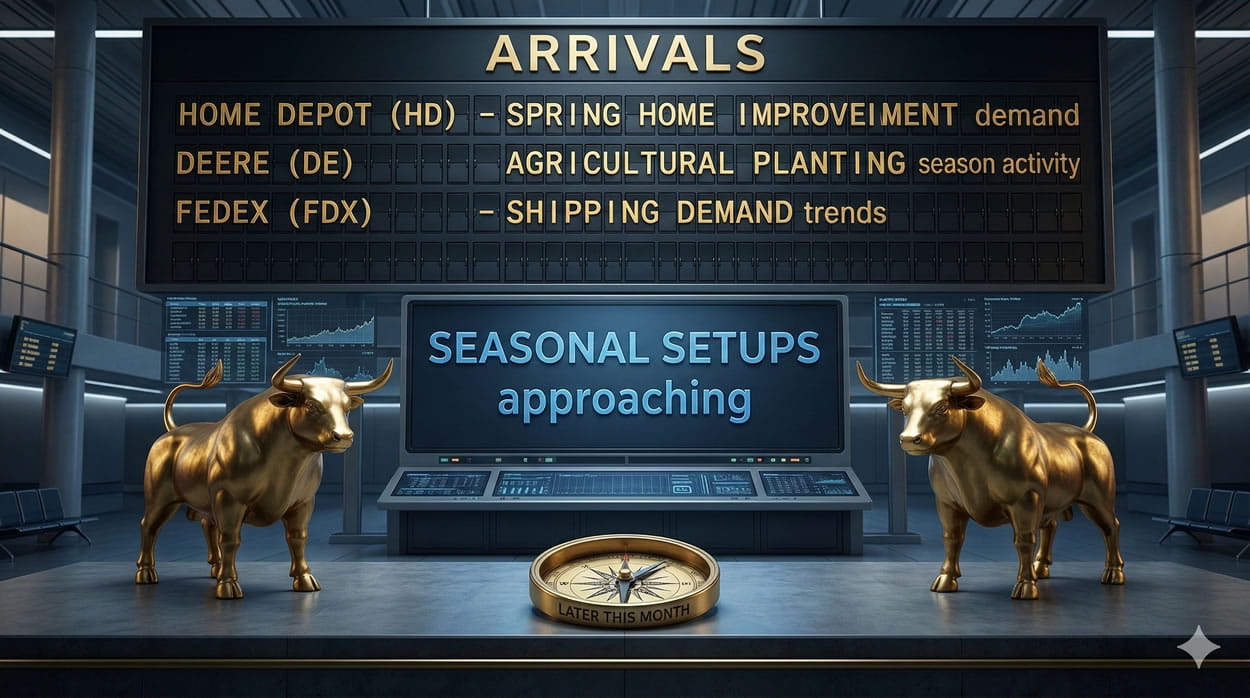
On the Radar
Several seasonal setups are approaching later this month:
- Home Depot (HD) – Spring home improvement demand
- Deere (DE) – Agricultural planting season activity
- FedEx (FDX) – Shipping demand trends
We’ll be watching these patterns closely in the weeks ahead.
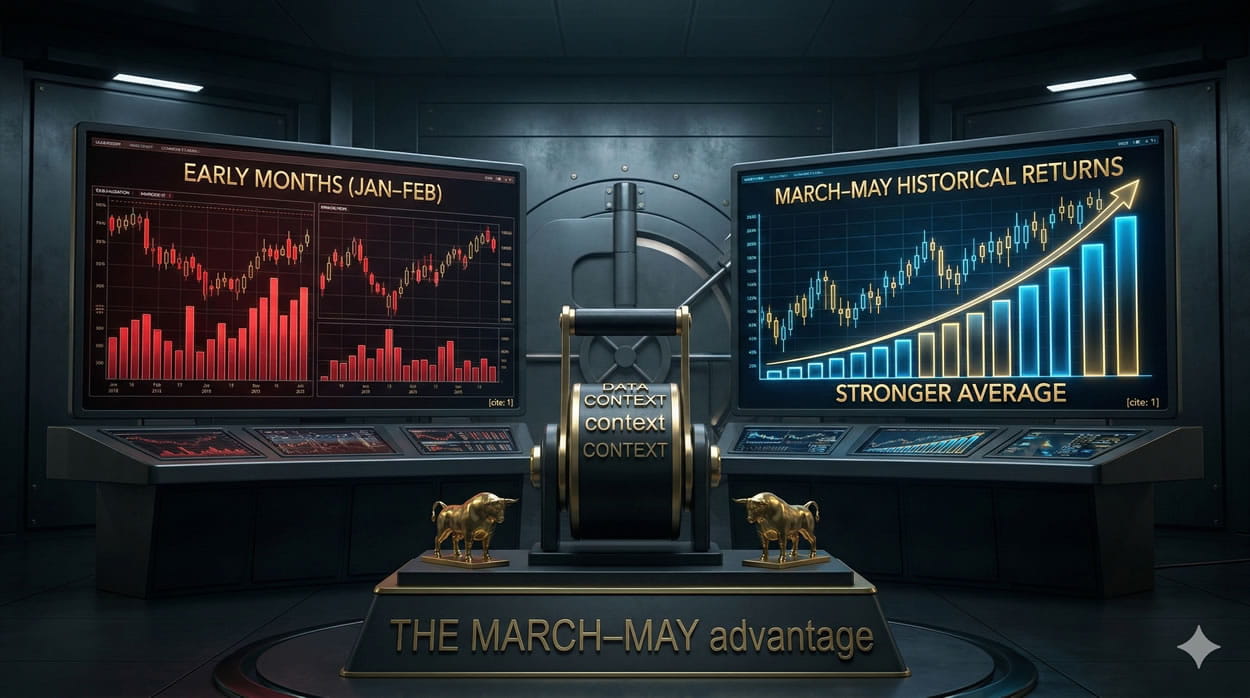
The Data Corner
Over the past 30 years, the March–May period has historically delivered stronger average returns for the S&P 500 than the first two months of the year.
While no seasonal pattern works every time, these historical tendencies can offer valuable context when evaluating potential opportunities.

Final Thoughts
Seasonality isn’t about predicting the future perfectly.
It’s about recognizing patterns created by repeating economic behavior.
Healthcare cycles.
Consumer habits.
Energy demand.
Institutional portfolio flows.
When those forces repeat year after year, the market often begins to move in recognizable ways.
Our goal each week is simply to identify those patterns early.
If you’d like to explore the full seasonal charts, data sets, and timing windows behind this week’s opportunities, you can access them by logging into:
SuperSeasonal.com
We’ll be back next Sunday with another look at the market’s hidden calendar.
Until then—
Trade smart.
Trade prepared.
And let the data guide you.
P.S.
One of the seasonal setups we identified this week has shown a win rate above 90% going back nearly three decades.
You can view the full seasonal chart and timing window inside the SuperSeasonal platform.
Just log in at SuperSeasonal.com to explore the data.
— Chad Shirley
Disclaimer
The information provided in this newsletter is for informational and educational purposes only and should not be considered investment advice. Past performance and historical seasonal patterns are not guarantees of future results. Trading and investing involve risk, including the potential loss of principal. Always conduct your own research and consult with a qualified financial professional before making any investment decisions. The publisher and its affiliates may hold positions in securities mentioned.