Date Written: Thursday, Oct. 23, 2025 @ 11 am EST.
In today’s Super Seasonals: Trade of the Week we will look at Marvell Technology, Inc. (NASDAQ: MRVL).
Overall Company Stats
Marvell Technology, Inc. (NASDAQ: MRVL) is a fabless semiconductor company specializing in data infrastructure solutions, including storage, networking, and custom AI accelerators. It powers data centers, cloud computing, and automotive/enterprise applications, with a growing emphasis on AI chips amid booming demand from hyperscalers like AWS and Google. Founded in 1995 and headquartered in Santa Clara, CA, Marvell has ~7,000 employees and focuses on high-margin, energy-efficient silicon for the “AI everywhere” era.
Financial Highlights (FY2025, Ending Feb 1, 2025)
Marvell reported solid revenue growth but remains in a growth-investment phase, with negative profitability due to R&D and acquisition costs (e.g., from Inphi and Avera deals). Q2 FY2026 (ended Aug 2025) marked a record, fueled by 58% YoY data center revenue growth.
Seasonality Confirmation for MRVL
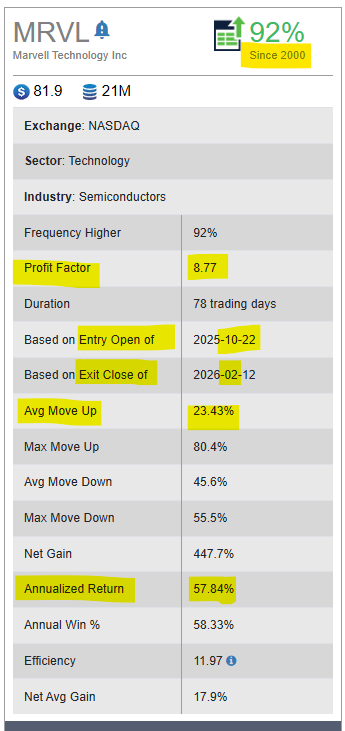
Historically, Marvell Technology (MRVL) has indeed shown strong seasonal strength heading into mid-February, particularly when entering positions in October. This pattern aligns with broader semiconductor sector seasonality, often driven by year-end budget flushes, AI/data center spending ramps, and pre-earnings optimism in Q4/Q1.
Below is a look at the seasonal pattern stats since 2000…

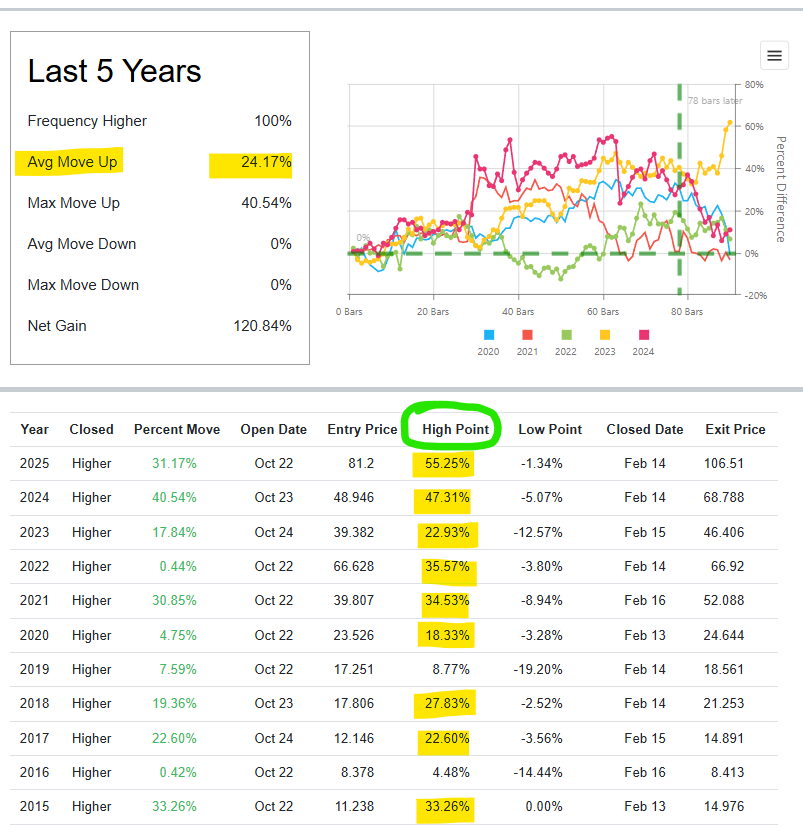
Below is a look at the past 5-10 years of the seasonal pattern…there’s some very good High Points in recent years…

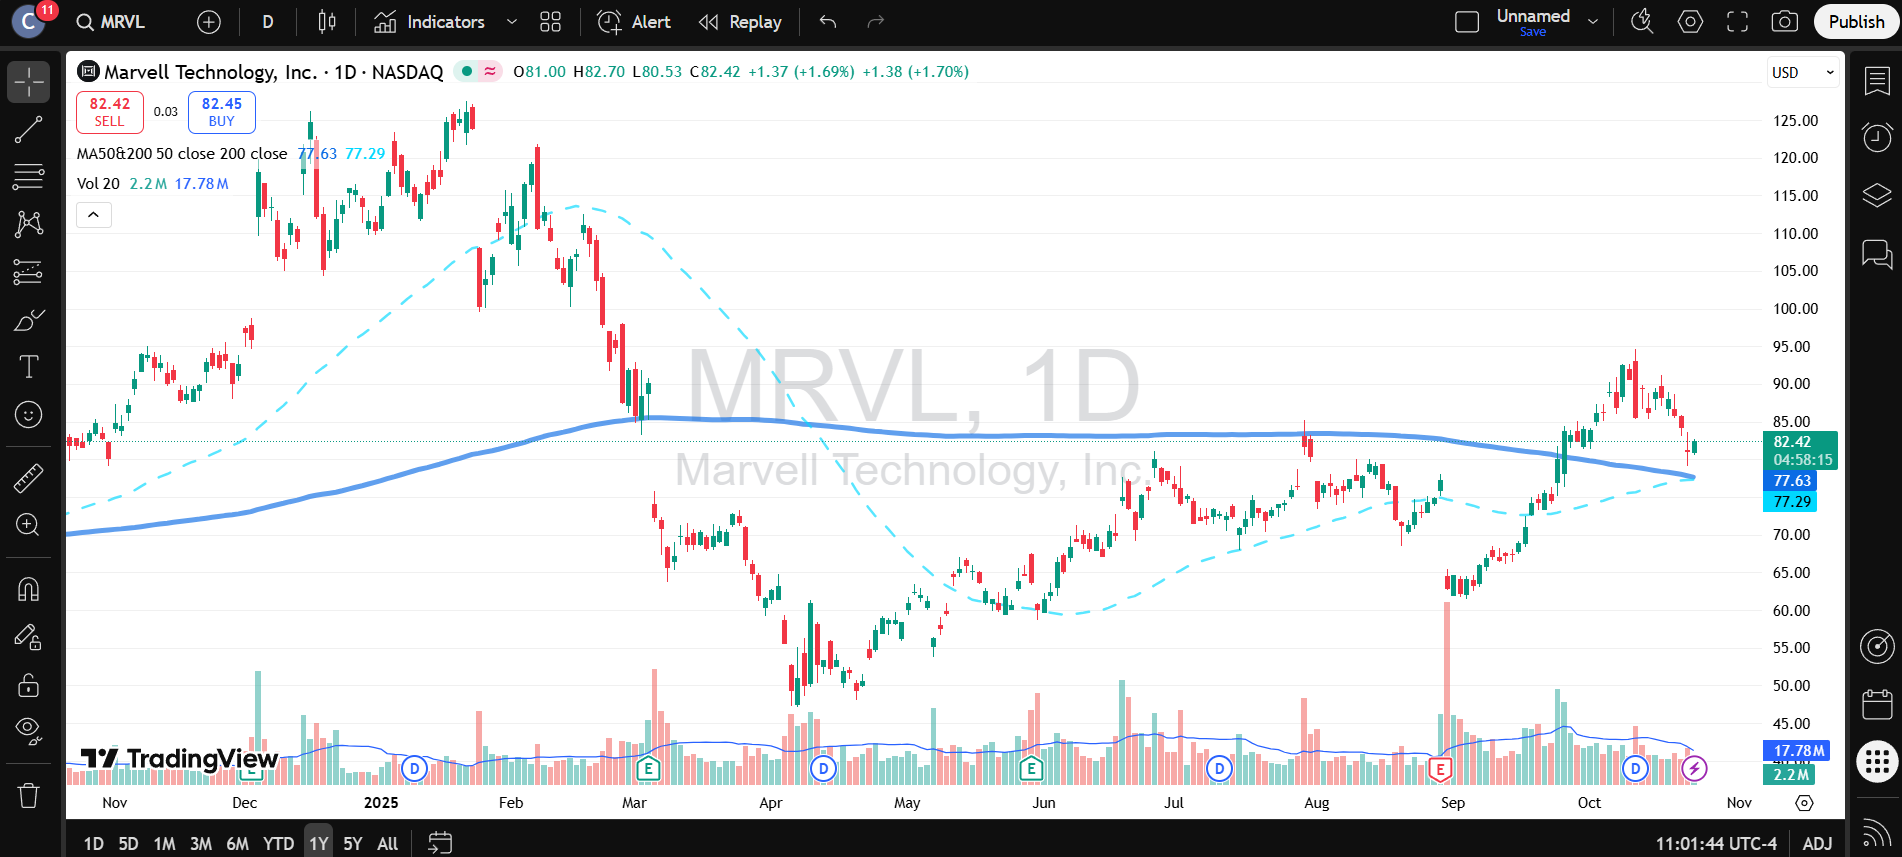
Current Trend (1 year chart below)
The immediate trend is bullish in the short term, with the stock rebounding ~22% over the last 30 days from lows around $67. This recovery is supported by higher trading volume on up days and the price breaking above its 50-day moving average (visually around $75–$80 on the chart). However, the broader 3–6 month trend remains choppy, as the stock trades well below its yearly high but above the yearly low. Momentum indicators (not shown but inferred from candle closes) suggest potential for further upside if it holds above $80, though resistance looms near $90–$95. Overall, the chart signals a “buy the dip” opportunity in a volatile AI/semiconductor space, but with risks of renewed downside if broader market sentiment sours.
In summary, the chart reflects Marvell’s rollercoaster ride tied to AI enthusiasm—big wins, sharp corrections, and now a rebound—mirroring the company’s transition to a high-growth AI player. While volatile, improving financials and analyst support point to long-term potential, though it’s not for the faint-hearted.

Position Strategy: Entry, Stop Loss, and Profit Targets
Given the current price of ~$81.05 (as of October 22, 2025 close, down 3.81% intraday amid broader market weakness), and the stock trading above its 50-day (~$77) and 200-day (~$78) moving averages (a bullish signal), this aligns well for a seasonal long position. The recent 3-month range is $61.44–$94.66, with the stock rebounding ~22% from September lows but pulling back from the 20-day MA (~$86).
I’d approach this as a momentum trade leveraging the October–February tailwind, with a risk-reward ratio of at least 1:2 (e.g., 5% risk for 10%+ reward). Position size: 1–2% of portfolio per trade, scaled in on confirmation.
Ideal Entry Points
- Primary Buy Zone: $80–$82 (current levels). Enter on a close above $82 with volume >10M shares, confirming short-term bullish momentum. This captures the seasonal start without chasing.
- Pullback Buy Zone: $76–$78 (near 50/200-day MAs). Wait for a dip here on light volume (e.g., market overreaction), offering better risk-reward. Avoid if it breaks below $75 decisively.
Stop Loss Zones
Place stops to protect against seasonal failures (e.g., the 20% negative periods like 2007–2008, tied to recessions). Use trailing stops as price advances.
- Tight Stop: $75 (just below 50-day MA and key support cluster). Risks ~7% from $81 entry; invalidates if broader semis (e.g., SOXX ETF) weaken.
- Wider Stop: $70 (below October swing low ~$67–$70 zone). Risks ~14%; suitable for longer holds, but monitor for gap-downs.
Profit Target Areas
Scale out in tranches to lock in gains, targeting the historical average +14.55% (~$93 from $81) by mid-February 2026. Align with resistance from recent highs and analyst levels.
- First Target (50% Position): $94 (recent 3-month high; +16% from entry). Take partial profits here if volume fades.
- Second Target (30% Position): $99–$100 (next resistance per technical forecasts; aligns with median seasonal gain of +17.75%).
- Stretch Target (20% Position): $110 (prior summer peak resistance; +36%, for blowout AI-driven quarters). Trail stop to breakeven after $94.
This setup assumes no major macro shocks (e.g., Fed hikes or AI slowdown). Monitor Q3 earnings (late Oct/early Nov 2025) for catalysts—strong data center guidance could accelerate upside —THIS IS NOT PERSONALIZED ADVICE.
In Closing…
As you likely know, there are literally dozens and dozens of solid ways to approach trading Marvell Technology, Inc. (NASDAQ: MRVL) with a bullish bias.
The decision of how to best invest in the stock or trade the options is an individualized decision, unfortunately there is no one best way. Keep in mind that seasonality is about probabilities, not certainties.
Please remember to fully understand the risk before trading anything.
It’s recommended to do your own research and consider consulting with a financial advisor before investing in any stock or options trade.
To learn more about seasonal information on other solid opportunities, click here SuperSeasonals.
Trade Smart,”
Chad Shirley


